FCRD

First Eagle Alternative Capital BDC, Inc.
FCRD
(1.8)4,54 USD
6.09% ROA
12.62% ROE
6.65x PER
677.113.605,00 USD
116.94% DER
11.22% Yield
52.43% NPM
First Eagle Alternative Capital BDC, Inc. Stock Analysis
First Eagle Alternative Capital BDC, Inc. Fundamental Analysis
Fundamental analysis in stock investing is like studying the foundation of a house before buying it. It involves looking at a company's financial health, like its earnings, assets, and debts, to determine if it's a good investment based on its fundamental strength and potential for growth.
| # | Analysis | Rating |
|---|---|---|
| 1 |
Dividend
The company's consistent dividend payouts over the past five years exemplify its strong commitment to providing shareholders with reliable returns, making it an attractive investment option. |
|
| 2 |
ROE
The stock's ROE falls within an average range (9.79%), demonstrating satisfactory profitability and efficiency in utilizing shareholders' equity. |
|
| 3 |
ROA
The stock's ROA (3.16%) shows that it's doing a pretty good job at making money from its assets, making it a solid choice to invest and earn steady profits. |
|
| 4 |
DER
The stock maintains a fair debt to equity ratio (79%), indicating a reasonable balance between the money it owes and the ownership it possesses. |
|
| 5 |
Graham Number
The company's Graham number suggests that its stock price is underestimated, implying that it may present a compelling investment opportunity. |
|
| 6 |
Buffet Intrinsic Value
The company's stock presents an enticing opportunity as it appears undervalued (80) by Warren Buffett's formula, indicating that its intrinsic value exceeds the market price. |
|
| 7 |
PBV
The stock's high Price-to-Book Value (P/BV) ratio (5.11x) suggests it's overvalued, potentially making it an expensive investment. |
|
| 8 |
Revenue Growth
Company's revenue has remained stagnant over the past three years, indicating a lack of growth and making it a less favorable option. |
|
| 9 |
Net Profit Growth
This company's net profit has remained flat over the past five years, suggesting a lack of growth and making it a less attractive investment opportunity. |
|
| 10 |
Assets Growth
Company's revenue has remained stagnant over the past three years, indicating a lack of growth and making it a less favorable option. |
|
| 11 |
Dividend Growth
The company's dividend growth has shown no improvement in the past three years, making it a less attractive investment option for those seeking increasing returns. |
First Eagle Alternative Capital BDC, Inc. Technical Analysis
Technical analysis in stock investing is like reading the patterns on a weather map to predict future weather conditions. It involves studying past stock price movements and trading volumes to make predictions about where a stock's price might go next, without necessarily looking at the company's financial health.
| # | Analysis | Recommendation |
|---|---|---|
| 1 | Awesome Oscillator | Buy |
| 2 | MACD | Buy |
| 3 | RSI | Sell |
| 4 | Stoch RSI | Buy |
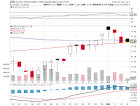
First Eagle Alternative Capital BDC, Inc. Price Chart
Financial Statements
Financial statements are like report cards for companies. They show how much money a company makes (income statement), what it owns and owes (balance sheet), and where it spends its money (cash flow statement), helping stock investors understand if a company is healthy and worth investing in.
Income Statements
An income statement for a company is like a scoreboard for its profits and losses. It shows how much money the company made (revenue) and how much it spent to make that money (expenses), helping stock investors see if a company is making a profit or not.
Revenue in stock investing is the total amount of money a company earns from its sales, and it's a key factor that investors consider to assess a company's financial performance and growth potential.
| Year | Revenue | Growth |
|---|---|---|
| 2010 | 12.325.432 | |
| 2011 | 37.408.627.000.000 | 100% |
| 2012 | 53.125.279.000.000 | 29.58% |
| 2013 | 74.650.000 | -71165712.46% |
| 2014 | 91.928.000 | 18.8% |
| 2015 | 245.625 | -37326.16% |
| 2016 | 15.106.035 | 98.37% |
| 2017 | 11.459.520 | -31.82% |
| 2018 | 12.327.640 | 7.04% |
| 2019 | 25.275.430 | 51.23% |
| 2020 | 46.532.000 | 45.68% |
| 2021 | 81.333.000 | 42.79% |
| 2022 | 35.516.000 | -129% |
| 2022 | 20.224.000 | -75.61% |
| 2023 | 184.134.000 | 89.02% |
| 2024 | 181.580.000 | -1.41% |
Research and Development Expenses are the costs a company incurs to create and improve its products or services, which can be important for investors to evaluate a company's innovation and potential for future growth.
| Year | Research and Development Expenses | Growth |
|---|---|---|
| 2010 | 0 | |
| 2011 | 0 | 0% |
| 2012 | 0 | 0% |
| 2013 | 0 | 0% |
| 2014 | 0 | 0% |
| 2015 | 0 | 0% |
| 2016 | 1 | 0% |
| 2017 | 0 | 0% |
| 2018 | 0 | 0% |
| 2019 | 1 | 0% |
| 2020 | 1 | 0% |
| 2021 | 1 | 0% |
| 2022 | 0 | 0% |
| 2022 | 0 | 0% |
| 2023 | 0 | 0% |
| 2024 | 0 | 0% |
General and Administrative Expenses are the costs a company incurs to run its day-to-day operations, such as office rent, salaries, and utilities, which investors consider to understand a company's overall efficiency and management effectiveness.
| Year | General and Administrative Expenses | Growth |
|---|---|---|
| 2010 | 940.381 | |
| 2011 | 1.907.912.000.000 | 100% |
| 2012 | 2.106.250.000.000 | 9.42% |
| 2013 | 3.265.000 | -64509854.06% |
| 2014 | 4.834.000 | 32.46% |
| 2015 | 1.911.844 | -152.84% |
| 2016 | 2.471.514 | 22.64% |
| 2017 | 2.642.678 | 6.48% |
| 2018 | 2.901.226 | 8.91% |
| 2019 | 3.460.846 | 16.17% |
| 2020 | 4.441.000 | 22.07% |
| 2021 | 4.872.000 | 8.85% |
| 2022 | 2.096.000 | -132.44% |
| 2022 | 4.486.000 | 53.28% |
| 2023 | 41.544.000 | 89.2% |
| 2024 | 5.120.000 | -711.41% |
EBITDA stands for Earnings Before Interest, Taxes, Depreciation, and Amortization. It is a measure that helps stock investors analyze a company's profitability by looking at its earnings without considering certain expenses. This helps to get a clearer picture of the company's financial performance and its ability to generate cash flow.
| Year | EBITDA | Growth |
|---|---|---|
| 2010 | 11.385.051 | |
| 2011 | 35.500.715.000.000 | 100% |
| 2012 | 51.019.029.000.000 | 30.42% |
| 2013 | 71.385.000 | -71470137.44% |
| 2014 | 87.094.000 | 18.04% |
| 2015 | -1.501.042 | 5902.24% |
| 2016 | 0 | 0% |
| 2017 | 0 | 0% |
| 2018 | 0 | 0% |
| 2019 | -2.112.689 | 100% |
| 2020 | 0 | 0% |
| 2021 | 0 | 0% |
| 2022 | 157.444.000 | 100% |
| 2022 | 45.435.000 | -246.53% |
| 2023 | 0 | 0% |
| 2024 | 148.304.000 | 100% |
Gross profit is the money a company makes from selling its products or services after subtracting the cost of producing or providing them, and it is an important measure for investors to understand a company's profitability.
| Year | Gross Profit | Growth |
|---|---|---|
| 2010 | 12.325.432 | |
| 2011 | 37.408.627.000.000 | 100% |
| 2012 | 53.125.279.000.000 | 29.58% |
| 2013 | 74.650.000 | -71165712.46% |
| 2014 | 91.928.000 | 18.8% |
| 2015 | -359.872 | 25644.64% |
| 2016 | 12.879.374 | 102.79% |
| 2017 | 7.119.485 | -80.9% |
| 2018 | 8.387.682 | 15.12% |
| 2019 | 20.579.994 | 59.24% |
| 2020 | 39.766.000 | 48.25% |
| 2021 | 61.861.000 | 35.72% |
| 2022 | 35.516.000 | -74.18% |
| 2022 | -243.000 | 14715.64% |
| 2023 | 184.134.000 | 100.13% |
| 2024 | 143.164.000 | -28.62% |
Net income in stock investing is like the money a company actually gets to keep as profit after paying all its bills, and it's an important measure to understand how well a company is doing financially.
| Year | Net Profit | Growth |
|---|---|---|
| 2010 | 0 | |
| 2011 | 0 | 0% |
| 2012 | 0 | 0% |
| 2013 | 0 | 0% |
| 2014 | 0 | 0% |
| 2015 | -2.155.042 | 100% |
| 2016 | 11.768.693 | 118.31% |
| 2017 | 9.055.186 | -29.97% |
| 2018 | 8.114.574 | -11.59% |
| 2019 | 29.278.523 | 72.28% |
| 2020 | 54.672.000 | 46.45% |
| 2021 | 83.633.000 | 34.63% |
| 2022 | 15.552.000 | -437.76% |
| 2022 | 15.544.000 | -0.05% |
| 2023 | 83.837.000 | 81.46% |
| 2024 | 81.540.000 | -2.82% |
EPS, or earnings per share, is a measure that shows how much profit a company has earned for each outstanding share of its stock, and it is important for stock investors as it helps understand the profitability of a company and compare it with other companies in the market.
| Year | Earning per Share (EPS) | Growth |
|---|---|---|
| 2010 | 0 | |
| 2011 | 0 | 0% |
| 2012 | 0 | 0% |
| 2013 | 0 | 0% |
| 2014 | 0 | 0% |
| 2015 | 0 | 0% |
| 2016 | 0 | 0% |
| 2017 | 0 | 0% |
| 2018 | 0 | 0% |
| 2019 | 2 | 100% |
| 2020 | 2 | 0% |
| 2021 | 3 | 50% |
| 2022 | 1 | 0% |
| 2022 | 1 | 0% |
| 2023 | 2 | 100% |
| 2024 | 2 | 0% |
Cashflow Statements
Cashflow statements show the movement of money in and out of a company, helping stock investors understand how much money a company makes and spends. By examining cashflow statements, investors can assess if a company is generating enough cash to pay its bills, invest in growth, and provide returns to stockholders.
Free cash flow is the leftover cash that a company generates after covering its operating expenses and capital expenditures, which is important for stock investors as it shows how much money a company has available to invest in growth, pay dividends, or reduce debt.
| Year | Free Cashflow | Growth |
|---|---|---|
| 2010 | -83.505.155 | |
| 2011 | -87.171.178.000.000 | 100% |
| 2012 | -95.408.782.000.000 | 8.63% |
| 2013 | -210.496.000 | -45325598.35% |
| 2014 | -95.913.000 | -119.47% |
| 2015 | -130.300.327 | 26.39% |
| 2016 | -78.423.654 | -66.15% |
| 2017 | -88.385.244 | 11.27% |
| 2018 | -164.554.116 | 46.29% |
| 2019 | -202.985.537 | 18.93% |
| 2020 | -61.799.000 | -228.46% |
| 2021 | -157.654.000 | 60.8% |
| 2022 | 3.771.000 | 4280.69% |
| 2022 | 27.951.000 | 86.51% |
| 2023 | 92.298.000 | 69.72% |
| 2024 | 22.159.000 | -316.53% |
Operating cash flow represents the cash generated or consumed by a company's day-to-day operations, excluding external investing or financing activities, and is crucial for stock investors as it shows how much cash a company is generating from its core business operations.
| Year | Operating Cashflow | Growth |
|---|---|---|
| 2010 | -83.505.155 | |
| 2011 | -87.171.178.000.000 | 100% |
| 2012 | -95.408.782.000.000 | 8.63% |
| 2013 | -210.496.000 | -45325598.35% |
| 2014 | -95.913.000 | -119.47% |
| 2015 | -130.300.327 | 26.39% |
| 2016 | -78.423.654 | -66.15% |
| 2017 | -88.385.244 | 11.27% |
| 2018 | -164.554.116 | 46.29% |
| 2019 | -202.985.537 | 18.93% |
| 2020 | -61.799.000 | -228.46% |
| 2021 | -157.654.000 | 60.8% |
| 2022 | 3.771.000 | 4280.69% |
| 2022 | 27.951.000 | 86.51% |
| 2023 | 92.298.000 | 69.72% |
| 2024 | 22.159.000 | -316.53% |
Capex, short for capital expenditures, refers to the money a company spends on acquiring or upgrading tangible assets like buildings, equipment, or technology, which is important for stock investors as it indicates how much a company is investing in its infrastructure to support future growth and profitability.
| Year | Capital Expenditure | Growth |
|---|---|---|
| 2010 | 0 | |
| 2011 | 0 | 0% |
| 2012 | 0 | 0% |
| 2013 | 0 | 0% |
| 2014 | 0 | 0% |
| 2015 | 0 | 0% |
| 2016 | 0 | 0% |
| 2017 | 0 | 0% |
| 2018 | 0 | 0% |
| 2019 | 0 | 0% |
| 2020 | 0 | 0% |
| 2021 | 0 | 0% |
| 2022 | 0 | 0% |
| 2022 | 0 | 0% |
| 2023 | 0 | 0% |
| 2024 | 0 | 0% |
Balance Sheet
Balance sheets provide a snapshot of a company's financial health and its assets (such as cash, inventory, and property) and liabilities (like debts and obligations) at a specific point in time. For stock investors, balance sheets help assess the company's overall worth and evaluate its ability to meet financial obligations and support future growth.
Equity refers to the ownership interest or stake that shareholders have in a company, representing their claim on its assets and earnings after all debts and liabilities are paid.
| Year | Equity | Growth |
|---|---|---|
| 2010 | 260.015.769 | |
| 2011 | 267.616.706.000.000 | 100% |
| 2012 | 288.711.392.000.000 | 7.31% |
| 2013 | 452.942.000 | -63741260.26% |
| 2014 | 443.621.000 | -2.1% |
| 2015 | 77.586.238 | -471.78% |
| 2016 | 314.116.287 | 75.3% |
| 2017 | 314.377.005 | 0.08% |
| 2018 | 484.918.009 | 35.17% |
| 2019 | 715.499.829 | 32.23% |
| 2020 | 1.017.083.000 | 29.65% |
| 2021 | 1.259.799.000 | 19.27% |
| 2022 | 1.249.930.000 | -0.79% |
| 2023 | 1.562.907.000 | 20.03% |
| 2024 | 752.440.000 | -107.71% |
Assets represent the valuable resources that a company owns, such as cash, inventory, property, and equipment, and understanding a company's assets helps investors assess its value and potential for generating future profits.
| Year | Assets | Growth |
|---|---|---|
| 2010 | 264.389.175 | |
| 2011 | 277.149.431.000.000 | 100% |
| 2012 | 347.484.943.000.000 | 20.24% |
| 2013 | 672.891.000 | -51640499% |
| 2014 | 812.485.000 | 17.18% |
| 2015 | 143.321.036 | -466.9% |
| 2016 | 225.564.977 | 36.46% |
| 2017 | 329.817.175 | 31.61% |
| 2018 | 505.119.956 | 34.71% |
| 2019 | 747.174.648 | 32.4% |
| 2020 | 1.054.152.000 | 29.12% |
| 2021 | 1.317.809.000 | 20.01% |
| 2022 | 1.302.878.000 | -1.15% |
| 2023 | 1.627.379.000 | 19.94% |
| 2024 | 1.672.432.000 | 2.69% |
Liabilities refer to the financial obligations or debts that a company owes to creditors or external parties, and understanding a company's liabilities is important for investors as it helps assess the company's financial risk and ability to meet its obligations.
| Year | Liabilities | Growth |
|---|---|---|
| 2010 | 0 | |
| 2011 | 0 | 0% |
| 2012 | 0 | 0% |
| 2013 | 0 | 0% |
| 2014 | 50.000.000 | 100% |
| 2015 | 65.734.798 | 23.94% |
| 2016 | 6.377 | -1030710.69% |
| 2017 | 157.017.186 | 100% |
| 2018 | 245.541.116 | 36.05% |
| 2019 | 340.257.846 | 27.84% |
| 2020 | 494.152.000 | 31.14% |
| 2021 | 665.524.000 | 25.75% |
| 2022 | 690.337.000 | 3.59% |
| 2023 | 884.785.000 | 21.98% |
| 2024 | 919.992.000 | 3.83% |
First Eagle Alternative Capital BDC, Inc. Financial Ratio (TTM)
Valuation Metrics
- Revenue per Share
- 4.77
- Net Income per Share
- 2.75
- Price to Earning Ratio
- 6.65x
- Price To Sales Ratio
- 3.83x
- POCF Ratio
- 7.28
- PFCF Ratio
- 7.28
- Price to Book Ratio
- 0.9
- EV to Sales
- 8.6
- EV Over EBITDA
- 11.37
- EV to Operating CashFlow
- 16.35
- EV to FreeCashFlow
- 16.35
- Earnings Yield
- 0.15
- FreeCashFlow Yield
- 0.14
- Market Cap
- 0,68 Bil.
- Enterprise Value
- 1,52 Bil.
- Graham Number
- 35.43
- Graham NetNet
- -21.72
Income Statement Metrics
- Net Income per Share
- 2.75
- Income Quality
- 0.91
- ROE
- 0.14
- Return On Assets
- 0.06
- Return On Capital Employed
- 0.1
- Net Income per EBT
- 0.99
- EBT Per Ebit
- 0.59
- Ebit per Revenue
- 0.9
- Effective Tax Rate
- 0.01
Margins
- Sales, General, & Administrative to Revenue
- 0.03
- Research & Developement to Revenue
- 0
- Stock Based Compensation to Revenue
- 0
- Gross Profit Margin
- 0.84
- Operating Profit Margin
- 0.9
- Pretax Profit Margin
- 0.53
- Net Profit Margin
- 0.52
Dividends
- Dividend Yield
- 0.11
- Dividend Yield %
- 11.22
- Payout Ratio
- 0.73
- Dividend Per Share
- 2.05
Operating Metrics
- Operating Cashflow per Share
- 2.51
- Free CashFlow per Share
- 2.51
- Capex to Operating CashFlow
- 0
- Capex to Revenue
- 0
- Capex to Depreciation
- 0
- Return on Invested Capital
- 0.08
- Return on Tangible Assets
- 0.06
- Days Sales Outstanding
- 38.48
- Days Payables Outstanding
- 250.32
- Days of Inventory on Hand
- 0
- Receivables Turnover
- 9.49
- Payables Turnover
- 1.46
- Inventory Turnover
- 0
- Capex per Share
- 0
Balance Sheet
- Cash per Share
- 2,72
- Book Value per Share
- 20,30
- Tangible Book Value per Share
- 20.3
- Shareholders Equity per Share
- 20.3
- Interest Debt per Share
- 25.33
- Debt to Equity
- 1.17
- Debt to Assets
- 0.53
- Net Debt to EBITDA
- 6.31
- Current Ratio
- 1.96
- Tangible Asset Value
- 0,75 Bil.
- Net Current Asset Value
- -0,87 Bil.
- Invested Capital
- 25627000
- Working Capital
- 0,03 Bil.
- Intangibles to Total Assets
- 0
- Average Receivables
- 0,02 Bil.
- Average Payables
- 0,03 Bil.
- Average Inventory
- 0.5
- Debt to Market Cap
- 1.3
Dividends
Dividends in stock investing are like rewards that companies give to their shareholders. They are a portion of the company's profits distributed to investors, typically in the form of cash payments, as a way for them to share in the company's success.
| Year | Dividends | Growth |
|---|---|---|
| 2010 | 0 | |
| 2011 | 1 | 100% |
| 2012 | 1 | 0% |
| 2013 | 1 | 0% |
| 2014 | 1 | 0% |
| 2015 | 1 | 0% |
| 2016 | 1 | 0% |
| 2017 | 1 | 0% |
| 2018 | 1 | 0% |
| 2019 | 1 | 0% |
| 2020 | 1 | 0% |
| 2021 | 0 | 0% |
| 2022 | 0 | 0% |
| 2023 | 0 | 0% |
First Eagle Alternative Capital BDC, Inc. Profile
About First Eagle Alternative Capital BDC, Inc.
THL Credit, Inc. is a business development company specializing in direct and fund of fund investments. The fund seeks to invest in debt and equity securities of middle market companies. It seeks to invest in PIPES, growth, acquisition, market or product expansion, recapitalization, mature, and change of control transactions in both sponsored and unsponsored issuers. The fund does not intend to invest in start-up companies, operationally distressed situations, or companies with speculative business plans. The fund invests primarily in debt securities, including unsecured subordinated or mezzanine debt and second lien secured debt, which may include an associated equity component such as warrants, preferred stock, options to buy minority interest, and other similar securities. Its investments may also include high-yield bonds, private equity investments, securities of public companies that are broadly traded, and securities of non-United States companies. It seeks to invest in outsourced business services, healthcare, financials, retailing, media, and consumer discretionary. The fund may make direct equity investments, including equity investments into or through funds, and also selectively invest in syndicated first lien secured loans, including unitranche investments. It seeks to invest between $10 million and $25 million of capital per transaction in companies with annual revenues ranging from $25 million to $500 million and annual EBITDA between $5 million and $25 million. The fund prefers to be a lead or sole investor in a transaction.
- CEO
- Mr. Christopher J. Flynn
- Employee
- 0
- Address
-
500 Boylston Street
Boston, 02110
First Eagle Alternative Capital BDC, Inc. Executives & BODs
| # | Name | Age |
|---|---|---|
| 1 |
Ms. Jennifer M. Wilson CPA Chief Accounting Officer & Treasurer |
70 |
| 2 |
Lauren Vieira IR contact |
70 |
| 3 |
Mr. Christopher J. Flynn Chief Executive Officer & Director |
70 |
| 4 |
Mr. James R. Fellows CFA Chief Investment Officer, Co-Head of Tradable Credit & Portfolio Mang. |
70 |
| 5 |
Mr. Howard H. Wu Co-Head of Direct Lending and Director |
70 |
First Eagle Alternative Capital BDC, Inc. Competitors