

 GA
GATX.US GATX Corporation
- Market cap
- USD 6.68B
- P/E
- 17.8x
- P/B
- 2.37x
- ROE
- 14.1%
- Dividend yield
- 1.34%
- Fundamental score
- -
Ratios use the latest price and the current fiscal year annualized from 3 quarters up to Sep 2026.
Is GATX.US undervalued?
Graham numberGATX.US trades 36.9% above its Graham number.
Graham number = √(22.5 × EPS × book value per share): the most a defensive investor should pay according to Benjamin Graham. An estimate, not a recommendation to buy or sell. How is it calculated?
GATX Corporation fundamental analysis
No fundamental analysis for GATX Corporation yet.
GATX Corporation stock price
Prices on the chart can differ slightly from the closing prices StockSummer uses for its ratios.
About GATX Corporation
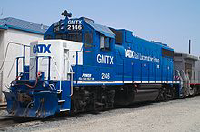
GATX Corporation, together its subsidiaries, operates as railcar leasing company in the United States, Canada, Mexico, Europe, and India. It operates through three segments: Rail North America, Rail International, and Engine Leasing. The company leases tank and freight railcars, and locomotives for petroleum, chemical, food/agriculture, and transportation industries. It also offers maintenance services, including the interior cleaning of railcars, routine maintenance and rep…
Full company profileGATX Corporation financial statements
2026 annualized: Fiscal year 2026 is not finished. Income statement and cash flow are annualized from 3 quarters up to Sep 30, 2026, the balance sheet is the latest quarter. Figures change when the annual report is published.
GATX Corporation annual financial statements (USD; K = thousand, M = million, B = billion, T = trillion)
| Item | 2016 | 2017 | 2018 | 2019 | 2020 | 2021 | 2022 | 2023 | 2024 | 2025 | 2026 Anlz |
|---|---|---|---|---|---|---|---|---|---|---|---|
| Income Statement | |||||||||||
| Revenue | 1.42B | 1.38B | 1.36B | 1.20B | 1.21B | 1.26B | 1.27B | 1.41B | 1.59B | 1.74B | 2.35B |
| Gross Profit | 586M | 548M | 537M | 493M | 494M | 539M | 573M | 1.33B | 761M | 846M | 1.07B |
| Operating Income | 367M | 332M | 313M | 281M | 287M | 297M | 340M | 1.12B | 474M | 534M | 701M |
| EBITDA | 683M | 647M | 700M | 658M | 658M | 776M | 762M | 1.12B | 1.02B | 1.27B | 1.15B |
| Net Income | 257M | 502M | 211M | 211M | 151M | 143M | 156M | 259M | 284M | 333M | 392M |
| EPS | 6.29 | 13 | 5.52 | 5.80 | 4.27 | 3.98 | 4.34 | 7.26 | 7.92 | 9.31 | 11 |
| Balance Sheet | |||||||||||
| Total Assets | 7.11B | 7.42B | 7.62B | 8.47B | 8.94B | 9.54B | 10.1B | 11.3B | 12.3B | 18.0B | 17.3B |
| Total Liabilities | 5.76B | 5.63B | 5.83B | 6.64B | 6.98B | 7.52B | 8.04B | 9.05B | 9.86B | 14.4B | 13.7B |
| Shareholders' Equity | 1.35B | 1.79B | 1.79B | 1.84B | 1.96B | 2.02B | 2.03B | 2.27B | 2.44B | 2.75B | 2.78B |
| Cash & Short-term Investments | 308M | 297M | 100M | 151M | 292M | 344M | 452M | 451M | 402M | 743M | 390M |
| Total Debt | 4.27B | 4.39B | 4.55B | 5.23B | 5.73B | 6.19B | 6.72B | 7.63B | 8.41B | 12.7B | 12.1B |
| Cash Flow | |||||||||||
| Operating Cash Flow | 626M | 497M | 509M | 463M | 428M | 507M | 534M | 520M | 602M | 648M | 959M |
| Capital Expenditure | 713M | 679M | 996M | 724M | 861M | 1.13B | 1.26B | 1.67B | 1.67B | 1.33B | 6.54B |
| Free Cash Flow | -86.7M | -182M | -487M | -261M | -433M | -623M | -722M | -1.14B | -1.07B | -684M | -5.58B |
| Ratios | |||||||||||
| ROE | 19.1% | 28.0% | 11.8% | 11.5% | 7.7% | 7.1% | 7.7% | 11.4% | 11.7% | 12.1% | 14.1% |
| ROA | 3.6% | 6.8% | 2.8% | 2.5% | 1.7% | 1.5% | 1.5% | 2.3% | 2.3% | 1.9% | 2.3% |
| Net Profit Margin | 18.1% | 36.5% | 15.5% | 17.6% | 12.5% | 11.4% | 12.2% | 18.4% | 17.9% | 19.2% | 16.7% |
| Debt to Equity | 3.17x | 2.45x | 2.55x | 2.85x | 2.93x | 3.07x | 3.31x | 3.35x | 3.45x | 4.61x | 4.33x |
What these items mean
- Revenue
- Total sales of goods and services in the period.
- Gross Profit
- Revenue minus the direct cost of producing what was sold.
- Operating Income
- Profit from the core business after operating expenses.
- EBITDA
- Earnings before interest, taxes, depreciation and amortization.
- Net Income
- Profit left for shareholders after all expenses, interest and taxes.
- EPS
- Net income divided by shares outstanding.
- Total Assets
- Everything the company owns.
- Total Liabilities
- Everything the company owes.
- Shareholders' Equity
- Assets minus liabilities: the book value that belongs to shareholders.
- Cash & Short-term Investments
- Cash and investments that can be turned into cash quickly.
- Total Debt
- Short and long-term borrowings.
- Operating Cash Flow
- Cash generated by the core business.
- Capital Expenditure
- Cash spent on property, plant and equipment.
- Free Cash Flow
- Operating cash flow minus capital expenditure: cash left for dividends, buybacks or debt repayment.
- ROE
- Return on equity: net income divided by shareholders' equity.
- ROA
- Return on assets: net income divided by total assets.
- Net Profit Margin
- Net income as a share of revenue.
- Debt to Equity
- Total debt divided by shareholders' equity.
GATX Corporation dividends
- Dividend yield
- 1.34%
- Forward dividend
- 2.64 USD
- Payout ratio
- 26.9%
- Ex-dividend date
- Dec 15, 2026
| Fiscal year | Dividends paid | Per share | Payout ratio |
|---|---|---|---|
| 2025 | USD 89.8M | 2.51 | 26.9% |
| 2024 | USD 84.8M | 2.36 | 29.8% |
| 2023 | USD 80.6M | 2.26 | 31.1% |
| 2022 | USD 76.6M | 2.13 | 49.1% |
| 2021 | USD 74.3M | 2.06 | 51.9% |
| 2020 | USD 71.0M | 2.01 | 46.9% |
| 2019 | USD 69.3M | 1.90 | 32.8% |
| 2018 | USD 69.3M | 1.81 | 32.8% |
| 2017 | USD 68.2M | 1.73 | 13.6% |
From the cash flow statement: dividends paid in the fiscal year, divided by that year's shares outstanding. Payout ratio = dividends paid / net income.
Last stock split: 2:1 on Jun 2, 1998.
Who owns GATX Corporation
- Insiders 1.95%
- Institutions 98.05%
- Public & others 0.00%
- Shares outstanding 34.9M
- Free float 34.7M
Top funds holding GATX.US
| Holder | Shares | % of shares | Change | As of |
|---|---|---|---|---|
| Avantis US Small Cap Value ETF | 1.72M | 4.93% | +0.65% | Oct 2026 |
| iShares Core S&P Mid-Cap ETF | 1.27M | 3.64% | +0.05% | Oct 2026 |
| Vanguard MStar Total Stk Mkt Idx Invest | 1.13M | 3.25% | +0.28% | Sep 2026 |
| iShares Russell 2000 ETF | 906K | 2.59% | 0.00% | Oct 2026 |
| Vanguard Small Cap Index | 794K | 2.28% | -2.86% | Sep 2026 |
| 1290 VT GAMCO Small Company Value IB | 656K | 1.88% | 0.00% | Sep 2026 |
| Vanguard MStar Small Cap Value Index | 517K | 1.48% | -0.38% | Sep 2026 |
| Vanguard Explorer Inv | 394K | 1.13% | 0.00% | Sep 2026 |
| Fidelity Small Cap Index | 393K | 1.13% | +0.17% | Aug 2026 |
| iShares Russell 2000 Value ETF | 313K | 0.90% | 0.00% | Oct 2026 |
| DFA U.S. Small Cap Value I | 295K | 0.85% | +48.46% | Sep 2026 |
| Gabelli Small Cap Growth AAA | 265K | 0.76% | -8.46% | Jun 2026 |
| Fidelity Small Cap Value Fund | 264K | 0.76% | -15.29% | Aug 2026 |
| State Street® SPDR® S&P MIDCAP 400® ETF | 261K | 0.75% | +0.54% | Sep 2026 |
| Harbor Small Cap Value Instl | 259K | 0.74% | -1.90% | Sep 2026 |
| American Funds SMALLCAP World A | 244K | 0.70% | 0.00% | Sep 2026 |
| DFA U.S. Small Cap I | 221K | 0.63% | 0.00% | Sep 2026 |
| DFA U.S. Targeted Value I | 210K | 0.60% | +0.92% | Sep 2026 |
| Vanguard Russell 2000 ETF | 209K | 0.60% | +1.15% | Sep 2026 |
| Vanguard Dividend Appreciation ETF | 200K | 0.57% | -0.62% | Sep 2026 |
Top institutions holding GATX.US
| Holder | Shares | % of shares | Change | As of |
|---|---|---|---|---|
| State Farm Mutual Automobile Ins Co | 5.43M | 15.55% | 0.00% | Jun 2026 |
| BlackRock Inc | 4.65M | 13.31% | +3.37% | Jun 2026 |
| Earnest Partners LLC | 2.56M | 7.33% | -2.24% | Jun 2026 |
| Vanguard Portfolio Management, LLC | 2.05M | 5.87% | +1.72% | Jun 2026 |
| Vanguard Capital Management, LLC | 1.60M | 4.58% | +1.21% | Jun 2026 |
| Dimensional Fund Advisors, Inc. | 1.56M | 4.47% | +2.36% | Sep 2026 |
| American Century Companies Inc | 1.40M | 4.00% | +10.63% | Jun 2026 |
| State Street Corp | 1.39M | 3.97% | +5.03% | Jun 2026 |
| Gamco Investors, Inc. Et Al | 1.05M | 3.02% | -4.18% | Jun 2026 |
| Bank of America Corp | 1.00M | 2.88% | -0.06% | Jun 2026 |
| Geode Capital Management, LLC | 963K | 2.76% | +5.25% | Jun 2026 |
| Gabelli Funds LLC | 811K | 2.32% | -4.06% | Jun 2026 |
| SEI Investments Co | 761K | 2.18% | -0.34% | Jun 2026 |
| Wellington Management Company LLP | 680K | 1.95% | -19.36% | Jun 2026 |
| Vaughan Nelson Scarbrgh & Mccullough LP | 643K | 1.84% | +7.59% | Jun 2026 |
| Northern Trust Corp | 625K | 1.79% | +2.58% | Jun 2026 |
| AllianceBernstein L.P. | 581K | 1.67% | +0.22% | Jun 2026 |
| Charles Schwab Investment Management Inc | 416K | 1.19% | -2.00% | Jun 2026 |
| FMR Inc | 398K | 1.14% | -27.37% | Jun 2026 |
| NORGES BANK | 372K | 1.07% | -26.75% | Jun 2026 |
GATX Corporation company profile
- Company name
- GATX Corporation
- Ticker
- GATX.US
- Exchange
- USA Stocks
- Listed since
- Nov 5, 1987
- Sector
- Industrials
- Industry
- Trading Companies & Distributors
- Employees
- 2,371
- Fiscal year end
- December
- Address
- 233 South Wacker Drive, Chicago, IL, United States, 60606-7147
- Phone
- 312 621 6200
- Website
- gatx.com
About GATX Corporation
GATX Corporation, together its subsidiaries, operates as railcar leasing company in the United States, Canada, Mexico, Europe, and India. It operates through three segments: Rail North America, Rail International, and Engine Leasing. The company leases tank and freight railcars, and locomotives for petroleum, chemical, food/agriculture, and transportation industries. It also offers maintenance services, including the interior cleaning of railcars, routine maintenance and repair of car body and safety appliances, regulatory compliance works, wheelset replacements, interior blast and lining, exterior blast and painting, and car stenciling services. In addition, the company manufactures commercial aircraft jet engines and leases aircraft spare engines; and owns and manages tank containers that are leased to chemical, industrial gas, energy, food, cryogenic and pharmaceutical industries, transport and logistic, and tank container operators, as well as provides tank container leasing, remarketing, and inspection and maintenance services. As of December 31, 2025, it owned and operated a fleet of approximately 156,000 railcars; 567 four-axle and 60 six-axle locomotives; 456 aircraft spare engines; and 25,602 tank containers. GATX Corporation was founded in 1898 and is headquartered in Chicago, Illinois.
GATX Corporation management
10- Mr. Robert C. Lyons C.F.A.President, CEO & Director · born 1964
- Mr. Thomas A. EllmanExecutive VP & CFO · born 1969
- Mr. Brian L. GlassbergExecutive VP, General Counsel & Corporate Secretary · born 1975
- Ms. Kimberley NeroExecutive VP & Chief Human Resources Officer · born 1975
- Mr. Paul F. Titterton C.F.A.Executive VP & President of Rail North America · born 1976
- Mr. Geoffrey D. PhillipsSenior Vice President of Operations · born 1969
- Mr. Eren DoygunSenior VP and Chief Planning & Investment Officer
- Ms. Jennifer M. McManusSenior VP, Controller & Chief Accounting Officer · born 1980
- Mr. Niyi A. AdedoyinSenior VP & Chief Information Officer · born 1968
- Ms. Shari HellermanVP of Investor Relations and Corporate Communications