HOUS

Anywhere Real Estate Inc.
HOUS
(0.8)3,27 USD
-2.74% ROA
-10.53% ROE
-10.82x PER
530.772.210,00 USD
181.89% DER
0% Yield
-3.06% NPM
Anywhere Real Estate Inc. Stock Analysis
Anywhere Real Estate Inc. Fundamental Analysis
Fundamental analysis in stock investing is like studying the foundation of a house before buying it. It involves looking at a company's financial health, like its earnings, assets, and debts, to determine if it's a good investment based on its fundamental strength and potential for growth.
| # | Analysis | Rating |
|---|---|---|
| 1 |
PBV
With a remarkably low PBV ratio (0.32x), the stock offers substantial upside potential at a bargain price. |
|
| 2 |
Graham Number
The Graham number of this company suggests that its stock price may be undervalued, indicating a potentially attractive investment opportunity. |
|
| 3 |
Assets Growth
Company has experienced no growth in revenue over the past three years, suggesting limited profitability and making it a less desirable investment opportunity. |
|
| 4 |
Dividend Growth
The company's dividend growth has been flat for the past three years, raising concerns for potential investors seeking reliable returns. |
|
| 5 |
Dividend
Investors should note the absence of dividends from the company in the last three years, indicating potential financial challenges. |
|
| 6 |
Buffet Intrinsic Value
Warren Buffett's formula suggests that the company's stock is overpriced (0), presenting a possible disadvantage for investors as its market price surpasses its estimated intrinsic value. |
|
| 7 |
ROE
The stock's ROE indicates a negative return (-25.09%) on shareholders' equity, suggesting poor financial performance. |
|
| 8 |
ROA
The stock's ROA (-22.69%) indicates that it's not effectively utilizing its assets to generate profits, making it a less favorable option to invest and earn consistent returns. |
|
| 9 |
DER
The stock is burdened with a heavy load of debt (179%), making it financially unstable and potentially risky for investors. |
|
| 10 |
Revenue Growth
Company has experienced no growth in revenue over the past three years, suggesting limited profitability and making it a less desirable investment opportunity. |
|
| 11 |
Net Profit Growth
Over the past five years, this company's net profit has failed to exhibit any growth, indicating a stagnant financial performance and making it a less favorable choice for potential investors. |
Anywhere Real Estate Inc. Technical Analysis
Technical analysis in stock investing is like reading the patterns on a weather map to predict future weather conditions. It involves studying past stock price movements and trading volumes to make predictions about where a stock's price might go next, without necessarily looking at the company's financial health.
| # | Analysis | Recommendation |
|---|---|---|
| 1 | Awesome Oscillator | Hold |
| 2 | MACD | Buy |
| 3 | RSI | Hold |
| 4 | Stoch RSI | Sell |
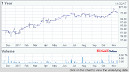
Anywhere Real Estate Inc. Price Chart
Financial Statements
Financial statements are like report cards for companies. They show how much money a company makes (income statement), what it owns and owes (balance sheet), and where it spends its money (cash flow statement), helping stock investors understand if a company is healthy and worth investing in.
Income Statements
An income statement for a company is like a scoreboard for its profits and losses. It shows how much money the company made (revenue) and how much it spent to make that money (expenses), helping stock investors see if a company is making a profit or not.
Revenue in stock investing is the total amount of money a company earns from its sales, and it's a key factor that investors consider to assess a company's financial performance and growth potential.
| Year | Revenue | Growth |
|---|---|---|
| 2009 | 3.932.000.000 | |
| 2010 | 4.090.000.000 | 3.86% |
| 2011 | 4.093.000.000 | 0.07% |
| 2012 | 4.672.000.000 | 12.39% |
| 2013 | 5.289.000.000 | 11.67% |
| 2014 | 5.328.000.000 | 0.73% |
| 2015 | 5.706.000.000 | 6.62% |
| 2016 | 5.810.000.000 | 1.79% |
| 2017 | 6.114.000.000 | 4.97% |
| 2018 | 6.079.000.000 | -0.58% |
| 2019 | 5.598.000.000 | -8.59% |
| 2020 | 6.221.000.000 | 10.01% |
| 2021 | 7.983.000.000 | 22.07% |
| 2022 | 6.908.000.000 | -15.56% |
| 2023 | 6.336.000.000 | -9.03% |
| 2023 | 5.636.000.000 | -12.42% |
| 2024 | 6.676.000.000 | 15.58% |
Research and Development Expenses are the costs a company incurs to create and improve its products or services, which can be important for investors to evaluate a company's innovation and potential for future growth.
| Year | Research and Development Expenses | Growth |
|---|---|---|
| 2009 | 0 | |
| 2010 | 0 | 0% |
| 2011 | 0 | 0% |
| 2012 | 0 | 0% |
| 2013 | 0 | 0% |
| 2014 | 0 | 0% |
| 2015 | 0 | 0% |
| 2016 | 0 | 0% |
| 2017 | 0 | 0% |
| 2018 | 11.000.000 | 100% |
| 2019 | 0 | 0% |
| 2020 | 0 | 0% |
| 2021 | 0 | 0% |
| 2022 | 0 | 0% |
| 2023 | 0 | 0% |
| 2023 | 0 | 0% |
| 2024 | 0 | 0% |
General and Administrative Expenses are the costs a company incurs to run its day-to-day operations, such as office rent, salaries, and utilities, which investors consider to understand a company's overall efficiency and management effectiveness.
| Year | General and Administrative Expenses | Growth |
|---|---|---|
| 2009 | 1.513.000.000 | |
| 2010 | 1.479.000.000 | -2.3% |
| 2011 | 1.524.000.000 | 2.95% |
| 2012 | 327.000.000 | -366.06% |
| 2013 | 327.000.000 | 0% |
| 2014 | 293.000.000 | -11.6% |
| 2015 | 337.000.000 | 13.06% |
| 2016 | 321.000.000 | -4.98% |
| 2017 | 364.000.000 | 11.81% |
| 2018 | 328.000.000 | -10.98% |
| 2019 | 288.000.000 | -13.89% |
| 2020 | 412.000.000 | 30.1% |
| 2021 | 441.000.000 | 6.58% |
| 2022 | 388.000.000 | -13.66% |
| 2023 | 416.000.000 | 6.73% |
| 2023 | 422.000.000 | 1.42% |
| 2024 | 372.000.000 | -13.44% |
EBITDA stands for Earnings Before Interest, Taxes, Depreciation, and Amortization. It is a measure that helps stock investors analyze a company's profitability by looking at its earnings without considering certain expenses. This helps to get a clearer picture of the company's financial performance and its ability to generate cash flow.
| Year | EBITDA | Growth |
|---|---|---|
| 2009 | 585.000.000 | |
| 2010 | 851.000.000 | 31.26% |
| 2011 | 443.000.000 | -92.1% |
| 2012 | 7.000.000 | -6228.57% |
| 2013 | 704.000.000 | 99.01% |
| 2014 | 728.000.000 | 3.3% |
| 2015 | 772.000.000 | 5.7% |
| 2016 | 764.000.000 | -1.05% |
| 2017 | 724.000.000 | -5.52% |
| 2018 | 659.000.000 | -9.86% |
| 2019 | 575.000.000 | -14.61% |
| 2020 | 594.000.000 | 3.2% |
| 2021 | 871.000.000 | 31.8% |
| 2022 | 476.000.000 | -82.98% |
| 2023 | 400.000.000 | -19% |
| 2023 | 188.000.000 | -112.77% |
| 2024 | 544.000.000 | 65.44% |
Gross profit is the money a company makes from selling its products or services after subtracting the cost of producing or providing them, and it is an important measure for investors to understand a company's profitability.
| Year | Gross Profit | Growth |
|---|---|---|
| 2009 | 2.082.000.000 | |
| 2010 | 2.158.000.000 | 3.52% |
| 2011 | 2.161.000.000 | 0.14% |
| 2012 | 2.353.000.000 | 8.16% |
| 2013 | 2.598.000.000 | 9.43% |
| 2014 | 2.573.000.000 | -0.97% |
| 2015 | 2.775.000.000 | 7.28% |
| 2016 | 2.865.000.000 | 3.14% |
| 2017 | 2.884.000.000 | 0.66% |
| 2018 | 2.797.000.000 | -3.11% |
| 2019 | 2.442.000.000 | -14.54% |
| 2020 | 2.694.000.000 | 9.35% |
| 2021 | 3.230.000.000 | 16.59% |
| 2022 | 2.493.000.000 | -29.56% |
| 2023 | 2.188.000.000 | -13.94% |
| 2023 | 1.972.000.000 | -10.95% |
| 2024 | 724.000.000 | -172.38% |
Net income in stock investing is like the money a company actually gets to keep as profit after paying all its bills, and it's an important measure to understand how well a company is doing financially.
| Year | Net Profit | Growth |
|---|---|---|
| 2009 | -262.000.000 | |
| 2010 | -99.000.000 | -164.65% |
| 2011 | -441.000.000 | 77.55% |
| 2012 | -543.000.000 | 18.78% |
| 2013 | 438.000.000 | 223.97% |
| 2014 | 143.000.000 | -206.29% |
| 2015 | 184.000.000 | 22.28% |
| 2016 | 213.000.000 | 13.62% |
| 2017 | 431.000.000 | 50.58% |
| 2018 | 137.000.000 | -214.6% |
| 2019 | -136.000.000 | 200.74% |
| 2020 | -487.000.000 | 72.07% |
| 2021 | 343.000.000 | 241.98% |
| 2022 | -255.000.000 | 234.51% |
| 2023 | 516.000.000 | 149.42% |
| 2023 | -97.000.000 | 631.96% |
| 2024 | 120.000.000 | 180.83% |
EPS, or earnings per share, is a measure that shows how much profit a company has earned for each outstanding share of its stock, and it is important for stock investors as it helps understand the profitability of a company and compare it with other companies in the market.
| Year | Earning per Share (EPS) | Growth |
|---|---|---|
| 2009 | -33 | |
| 2010 | -12 | -166.67% |
| 2011 | -55 | 78.18% |
| 2012 | -14 | -292.86% |
| 2013 | 3 | 566.67% |
| 2014 | 1 | 0% |
| 2015 | 1 | 100% |
| 2016 | 1 | 0% |
| 2017 | 3 | 66.67% |
| 2018 | 1 | -200% |
| 2019 | -1 | 200% |
| 2020 | -4 | 75% |
| 2021 | 3 | 300% |
| 2022 | -2 | 200% |
| 2023 | 5 | 150% |
| 2023 | -1 | 0% |
| 2024 | 1 | 100% |
Cashflow Statements
Cashflow statements show the movement of money in and out of a company, helping stock investors understand how much money a company makes and spends. By examining cashflow statements, investors can assess if a company is generating enough cash to pay its bills, invest in growth, and provide returns to stockholders.
Free cash flow is the leftover cash that a company generates after covering its operating expenses and capital expenditures, which is important for stock investors as it shows how much money a company has available to invest in growth, pay dividends, or reduce debt.
| Year | Free Cashflow | Growth |
|---|---|---|
| 2009 | 301.000.000 | |
| 2010 | -167.000.000 | 280.24% |
| 2011 | -241.000.000 | 30.71% |
| 2012 | -157.000.000 | -53.5% |
| 2013 | 430.000.000 | 136.51% |
| 2014 | 352.000.000 | -22.16% |
| 2015 | 460.000.000 | 23.48% |
| 2016 | 500.000.000 | 8% |
| 2017 | 568.000.000 | 11.97% |
| 2018 | 289.000.000 | -96.54% |
| 2019 | 263.000.000 | -9.89% |
| 2020 | 653.000.000 | 59.72% |
| 2021 | 542.000.000 | -20.48% |
| 2022 | -201.000.000 | 369.65% |
| 2023 | 127.000.000 | 258.27% |
| 2023 | 115.000.000 | -10.43% |
| 2024 | 21.000.000 | -447.62% |
Operating cash flow represents the cash generated or consumed by a company's day-to-day operations, excluding external investing or financing activities, and is crucial for stock investors as it shows how much cash a company is generating from its core business operations.
| Year | Operating Cashflow | Growth |
|---|---|---|
| 2009 | 341.000.000 | |
| 2010 | -118.000.000 | 388.98% |
| 2011 | -192.000.000 | 38.54% |
| 2012 | -103.000.000 | -86.41% |
| 2013 | 492.000.000 | 120.93% |
| 2014 | 423.000.000 | -16.31% |
| 2015 | 544.000.000 | 22.24% |
| 2016 | 587.000.000 | 7.33% |
| 2017 | 667.000.000 | 11.99% |
| 2018 | 394.000.000 | -69.29% |
| 2019 | 371.000.000 | -6.2% |
| 2020 | 748.000.000 | 50.4% |
| 2021 | 643.000.000 | -16.33% |
| 2022 | -92.000.000 | 798.91% |
| 2023 | 145.000.000 | 163.45% |
| 2023 | 187.000.000 | 22.46% |
| 2024 | 39.000.000 | -379.49% |
Capex, short for capital expenditures, refers to the money a company spends on acquiring or upgrading tangible assets like buildings, equipment, or technology, which is important for stock investors as it indicates how much a company is investing in its infrastructure to support future growth and profitability.
| Year | Capital Expenditure | Growth |
|---|---|---|
| 2009 | 40.000.000 | |
| 2010 | 49.000.000 | 18.37% |
| 2011 | 49.000.000 | 0% |
| 2012 | 54.000.000 | 9.26% |
| 2013 | 62.000.000 | 12.9% |
| 2014 | 71.000.000 | 12.68% |
| 2015 | 84.000.000 | 15.48% |
| 2016 | 87.000.000 | 3.45% |
| 2017 | 99.000.000 | 12.12% |
| 2018 | 105.000.000 | 5.71% |
| 2019 | 108.000.000 | 2.78% |
| 2020 | 95.000.000 | -13.68% |
| 2021 | 101.000.000 | 5.94% |
| 2022 | 109.000.000 | 7.34% |
| 2023 | 18.000.000 | -505.56% |
| 2023 | 72.000.000 | 75% |
| 2024 | 18.000.000 | -300% |
Balance Sheet
Balance sheets provide a snapshot of a company's financial health and its assets (such as cash, inventory, and property) and liabilities (like debts and obligations) at a specific point in time. For stock investors, balance sheets help assess the company's overall worth and evaluate its ability to meet financial obligations and support future growth.
Equity refers to the ownership interest or stake that shareholders have in a company, representing their claim on its assets and earnings after all debts and liabilities are paid.
| Year | Equity | Growth |
|---|---|---|
| 2009 | -981.000.000 | |
| 2010 | -1.072.000.000 | 8.49% |
| 2011 | -1.499.000.000 | 28.49% |
| 2012 | 1.519.000.000 | 198.68% |
| 2013 | 2.013.000.000 | 24.54% |
| 2014 | 2.183.000.000 | 7.79% |
| 2015 | 2.422.000.000 | 9.87% |
| 2016 | 2.469.000.000 | 1.9% |
| 2017 | 2.622.000.000 | 5.84% |
| 2018 | 2.315.000.000 | -13.26% |
| 2019 | 2.096.000.000 | -10.45% |
| 2020 | 1.767.000.000 | -18.62% |
| 2021 | 2.192.000.000 | 19.39% |
| 2022 | 1.767.000.000 | -24.05% |
| 2023 | 1.785.000.000 | 1.01% |
| 2023 | 1.681.000.000 | -6.19% |
| 2024 | 1.614.000.000 | -4.15% |
Assets represent the valuable resources that a company owns, such as cash, inventory, property, and equipment, and understanding a company's assets helps investors assess its value and potential for generating future profits.
| Year | Assets | Growth |
|---|---|---|
| 2009 | 8.041.000.000 | |
| 2010 | 8.029.000.000 | -0.15% |
| 2011 | 7.350.000.000 | -9.24% |
| 2012 | 7.445.000.000 | 1.28% |
| 2013 | 7.326.000.000 | -1.62% |
| 2014 | 7.538.000.000 | 2.81% |
| 2015 | 7.531.000.000 | -0.09% |
| 2016 | 7.421.000.000 | -1.48% |
| 2017 | 7.337.000.000 | -1.14% |
| 2018 | 7.290.000.000 | -0.64% |
| 2019 | 7.543.000.000 | 3.35% |
| 2020 | 6.934.000.000 | -8.78% |
| 2021 | 7.210.000.000 | 3.83% |
| 2022 | 6.383.000.000 | -12.96% |
| 2023 | 6.059.000.000 | -5.35% |
| 2023 | 5.839.000.000 | -3.77% |
| 2024 | 5.846.000.000 | 0.12% |
Liabilities refer to the financial obligations or debts that a company owes to creditors or external parties, and understanding a company's liabilities is important for investors as it helps assess the company's financial risk and ability to meet its obligations.
| Year | Liabilities | Growth |
|---|---|---|
| 2009 | 9.022.000.000 | |
| 2010 | 9.101.000.000 | 0.87% |
| 2011 | 8.849.000.000 | -2.85% |
| 2012 | 5.926.000.000 | -49.33% |
| 2013 | 5.313.000.000 | -11.54% |
| 2014 | 5.355.000.000 | 0.78% |
| 2015 | 5.109.000.000 | -4.82% |
| 2016 | 4.952.000.000 | -3.17% |
| 2017 | 4.715.000.000 | -5.03% |
| 2018 | 4.975.000.000 | 5.23% |
| 2019 | 5.447.000.000 | 8.67% |
| 2020 | 5.167.000.000 | -5.42% |
| 2021 | 5.018.000.000 | -2.97% |
| 2022 | 4.616.000.000 | -8.71% |
| 2023 | 4.274.000.000 | -8% |
| 2023 | 4.158.000.000 | -2.79% |
| 2024 | 4.232.000.000 | 1.75% |
Anywhere Real Estate Inc. Financial Ratio (TTM)
Valuation Metrics
- Revenue per Share
- 50.62
- Net Income per Share
- -0.44
- Price to Earning Ratio
- -10.82x
- Price To Sales Ratio
- 0.09x
- POCF Ratio
- -27.92
- PFCF Ratio
- -5.71
- Price to Book Ratio
- 0.33
- EV to Sales
- 0.65
- EV Over EBITDA
- 15.55
- EV to Operating CashFlow
- -191.57
- EV to FreeCashFlow
- -39.14
- Earnings Yield
- -0.09
- FreeCashFlow Yield
- -0.18
- Market Cap
- 0,53 Bil.
- Enterprise Value
- 3,64 Bil.
- Graham Number
- 11.99
- Graham NetNet
- -34.57
Income Statement Metrics
- Net Income per Share
- -0.44
- Income Quality
- 0.39
- ROE
- -0.03
- Return On Assets
- -0.03
- Return On Capital Employed
- 0.25
- Net Income per EBT
- 0.8
- EBT Per Ebit
- -0.2
- Ebit per Revenue
- 0.19
- Effective Tax Rate
- 0.17
Margins
- Sales, General, & Administrative to Revenue
- 0.07
- Research & Developement to Revenue
- 0
- Stock Based Compensation to Revenue
- 0
- Gross Profit Margin
- 0.27
- Operating Profit Margin
- 0.19
- Pretax Profit Margin
- -0.04
- Net Profit Margin
- -0.03
Dividends
- Dividend Yield
- 0
- Dividend Yield %
- 0
- Payout Ratio
- -0.14
- Dividend Per Share
- 0
Operating Metrics
- Operating Cashflow per Share
- -0.17
- Free CashFlow per Share
- -0.84
- Capex to Operating CashFlow
- -3.89
- Capex to Revenue
- 0.01
- Capex to Depreciation
- 0.37
- Return on Invested Capital
- 0.28
- Return on Tangible Assets
- -0.03
- Days Sales Outstanding
- 21.72
- Days Payables Outstanding
- 7.96
- Days of Inventory on Hand
- 0
- Receivables Turnover
- 16.8
- Payables Turnover
- 45.86
- Inventory Turnover
- 0
- Capex per Share
- 0.67
Balance Sheet
- Cash per Share
- 1,23
- Book Value per Share
- 14,51
- Tangible Book Value per Share
- -21.96
- Shareholders Equity per Share
- 14.5
- Interest Debt per Share
- 27.74
- Debt to Equity
- 1.82
- Debt to Assets
- 0.5
- Net Debt to EBITDA
- 13.29
- Current Ratio
- 0.46
- Tangible Asset Value
- -2,44 Bil.
- Net Current Asset Value
- -3,54 Bil.
- Invested Capital
- 3864000000
- Working Capital
- -0,81 Bil.
- Intangibles to Total Assets
- 0.69
- Average Receivables
- 0,30 Bil.
- Average Payables
- 0,10 Bil.
- Average Inventory
- 0
- Debt to Market Cap
- 5.52
Dividends
Dividends in stock investing are like rewards that companies give to their shareholders. They are a portion of the company's profits distributed to investors, typically in the form of cash payments, as a way for them to share in the company's success.
| Year | Dividends | Growth |
|---|---|---|
| 2016 | 0 | |
| 2017 | 0 | 0% |
| 2018 | 0 | 0% |
| 2019 | 0 | 0% |
Anywhere Real Estate Inc. Profile
About Anywhere Real Estate Inc.
Anywhere Real Estate Inc., through its subsidiaries, provides residential real estate services. It operates through three segments: Realogy Franchise Group, and Realogy Brokerage Group. The Realogy Franchise Group segment franchises its residential real estate brokerages under the Century 21, Coldwell Banker, Coldwell Banker Commercial, Corcoran, ERA, Sotheby's International Realty, and Better Homes and Gardens Real Estate brand names. This segment also offers lead generation and relocation services. As of December 31, 2020, this segment's real estate franchise systems and proprietary brands had approximately 20,100 offices and 320,700 independent sales agents worldwide. The Realogy Brokerage Group segment owns and operates a full-service residential real estate brokerage business under the Coldwell Banker, Corcoran, and Sotheby's International Realty brand names to assist home buyers and sellers in the listing, marketing, selling, and finding homes. As of December 31, 2020, this segment owned and operated 670 brokerage offices with approximately 53,100 independent sales agents. The Realogy Title Group segment provides title, escrow, and settlement services to real estate companies, corporations, and financial institutions. This segment also serves as an underwriter of title insurance policies in connection with residential and commercial real estate transactions. The company was formerly known as Realogy Holdings Corp. and changed its name to Anywhere Real Estate Inc. in June 2022. Anywhere Real Estate Inc. was incorporated in 2006 and is headquartered in Madison, New Jersey.
- CEO
- Mr. Ryan M. Schneider Ph.D.
- Employee
- 7.965
- Address
-
175 Park Avenue
Madison, 07940-1123
Anywhere Real Estate Inc. Executives & BODs
| # | Name | Age |
|---|---|---|
| 1 |
Mr. Rudy Wolfs Executive Vice President & Chief Technology Officer |
70 |
| 2 |
Ms. Charlotte C. Simonelli Executive Vice President & Chief Financial Officer |
70 |
| 3 |
Ms. Susan Yannaccone Executive Vice President, President & Chief Executive Officer of Anywhere Brands and President & CEO of Anywhere Advisors LLC |
70 |
| 4 |
Mr. Timothy B. Gustavson CPA Senior Vice President, Chief Accounting Officer & Controller |
70 |
| 5 |
Ms. Shacara N. Delgado Senior Vice President of Employment Law and Chief Ethics & Compliance Officer |
70 |
| 6 |
Ms. Tanya Reu-Narvaez Executive Vice President & Chief People Officer |
70 |
| 7 |
Mr. Ryan M. Schneider Ph.D. Chief Executive Officer, President & Director |
70 |
| 8 |
Ms. Marilyn Joy Wasser Esq. Executive Vice President, General Counsel & Corporate Secretary |
70 |
| 9 |
Ms. Alicia Swift Senior Vice President of Investor Relations & Treasury |
70 |
| 10 |
Mr. Trey Sarten Chief Communications Officer & Head of Public Affairs |
70 |
Anywhere Real Estate Inc. Competitors