KAP.IL

JSC National Atomic Company Kazatomprom
KAP.IL
(3.8)40,35 USD
17.62% ROA
29.52% ROE
10.68x PER
4.611.336.337.160,00 USD
9.32% DER
7.09% Yield
28.47% NPM
JSC National Atomic Company Kazatomprom Stock Analysis
JSC National Atomic Company Kazatomprom Fundamental Analysis
Fundamental analysis in stock investing is like studying the foundation of a house before buying it. It involves looking at a company's financial health, like its earnings, assets, and debts, to determine if it's a good investment based on its fundamental strength and potential for growth.
| # | Analysis | Rating |
|---|---|---|
| 1 |
ROE
ROE surpassing expectations (25.2%) highlights strong profitability and efficient use of shareholders' equity, making it an appealing investment prospect. |
|
| 2 |
ROA
This stock has a great ability to make a lot of money from the things it owns, which makes it a really good investment for smart investors. |
|
| 3 |
DER
The stock has a minimal amount of debt (8%) relative to its ownership, showcasing a strong financial position and lower risk for investors. |
|
| 4 |
Revenue Growth
This company's revenue has experienced steady growth over the last five years, indicating a reliable and prosperous financial trajectory. |
|
| 5 |
Assets Growth
With continuous growth in revenue over the last five years, this company has proven to be a lucrative investment option, showcasing its strong financial performance. |
|
| 6 |
Dividend
Investors can take comfort in the company's unwavering commitment to dividends, as it has consistently distributed payouts over the past five years, ensuring a reliable income stream. |
|
| 7 |
Net Profit Growth
This company's net profit has consistently grown over the past three years, showcasing a positive financial trend and making it an appealing investment opportunity. |
|
| 8 |
Graham Number
The Graham number of this company suggests that its stock price may be undervalued, indicating a potentially attractive investment opportunity. |
|
| 9 |
Buffet Intrinsic Value
The company's stock shows potential as it is undervalued (67.095) according to Warren Buffett's formula, indicating that its intrinsic value exceeds the market price. |
|
| 10 |
PBV
The stock's high Price-to-Book Value (P/BV) ratio (3.39x) suggests it's overvalued, potentially making it an expensive investment. |
|
| 11 |
Dividend Growth
The company's dividend growth has remained unchanged for three years, signaling a lack of positive momentum and making it a less favorable investment choice. |
JSC National Atomic Company Kazatomprom Technical Analysis
Technical analysis in stock investing is like reading the patterns on a weather map to predict future weather conditions. It involves studying past stock price movements and trading volumes to make predictions about where a stock's price might go next, without necessarily looking at the company's financial health.
| # | Analysis | Recommendation |
|---|---|---|
| 1 | Awesome Oscillator | Sell |
| 2 | MACD | Buy |
| 3 | RSI | Hold |
| 4 | Stoch RSI | Sell |
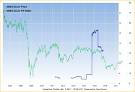
JSC National Atomic Company Kazatomprom Price Chart
Financial Statements
Financial statements are like report cards for companies. They show how much money a company makes (income statement), what it owns and owes (balance sheet), and where it spends its money (cash flow statement), helping stock investors understand if a company is healthy and worth investing in.
Income Statements
An income statement for a company is like a scoreboard for its profits and losses. It shows how much money the company made (revenue) and how much it spent to make that money (expenses), helping stock investors see if a company is making a profit or not.
Revenue in stock investing is the total amount of money a company earns from its sales, and it's a key factor that investors consider to assess a company's financial performance and growth potential.
| Year | Revenue | Growth |
|---|---|---|
| 2015 | 383.960.000.000 | |
| 2016 | 394.315.000.000 | 2.63% |
| 2017 | 336.517.000.000 | -17.18% |
| 2018 | 436.632.000.000 | 22.93% |
| 2019 | 502.269.000.000 | 13.07% |
| 2020 | 587.457.000.000 | 14.5% |
| 2021 | 691.011.000.000 | 14.99% |
| 2022 | 1.001.171.000.000 | 30.98% |
| 2023 | 983.476.000.000 | -1.8% |
| 2023 | 1.434.635.000.000 | 31.45% |
| 2024 | 1.725.148.000.000 | 16.84% |
Research and Development Expenses are the costs a company incurs to create and improve its products or services, which can be important for investors to evaluate a company's innovation and potential for future growth.
| Year | Research and Development Expenses | Growth |
|---|---|---|
| 2015 | 695.000.000 | |
| 2016 | 89.000.000 | -680.9% |
| 2017 | 32.000.000 | -178.13% |
| 2018 | 230.000.000 | 86.09% |
| 2019 | 499.000.000 | 53.91% |
| 2020 | 505.000.000 | 1.19% |
| 2021 | 725.000.000 | 30.34% |
| 2022 | 887.000.000 | 18.26% |
| 2023 | 0 | 0% |
| 2023 | 806.000.000 | 100% |
| 2024 | 0 | 0% |
General and Administrative Expenses are the costs a company incurs to run its day-to-day operations, such as office rent, salaries, and utilities, which investors consider to understand a company's overall efficiency and management effectiveness.
| Year | General and Administrative Expenses | Growth |
|---|---|---|
| 2015 | 5.141.000.000 | |
| 2016 | 8.857.000.000 | 41.96% |
| 2017 | 7.448.000.000 | -18.92% |
| 2018 | 15.022.000.000 | 50.42% |
| 2019 | 9.080.000.000 | -65.44% |
| 2020 | 8.136.000.000 | -11.6% |
| 2021 | 10.321.000.000 | 21.17% |
| 2022 | 13.227.000.000 | 21.97% |
| 2023 | 12.428.000.000 | -6.43% |
| 2023 | 23.719.000.000 | 47.6% |
| 2024 | 13.972.000.000 | -69.76% |
EBITDA stands for Earnings Before Interest, Taxes, Depreciation, and Amortization. It is a measure that helps stock investors analyze a company's profitability by looking at its earnings without considering certain expenses. This helps to get a clearer picture of the company's financial performance and its ability to generate cash flow.
| Year | EBITDA | Growth |
|---|---|---|
| 2015 | 81.406.000.000 | |
| 2016 | 159.857.000.000 | 49.08% |
| 2017 | 87.678.000.000 | -82.32% |
| 2018 | 102.990.000.000 | 14.87% |
| 2019 | 190.290.000.000 | 45.88% |
| 2020 | 270.888.000.000 | 29.75% |
| 2021 | 293.044.000.000 | 7.56% |
| 2022 | 587.555.000.000 | 50.12% |
| 2023 | 455.308.000.000 | -29.05% |
| 2023 | 780.165.000.000 | 41.64% |
| 2024 | 946.116.000.000 | 17.54% |
Gross profit is the money a company makes from selling its products or services after subtracting the cost of producing or providing them, and it is an important measure for investors to understand a company's profitability.
| Year | Gross Profit | Growth |
|---|---|---|
| 2015 | 103.362.000.000 | |
| 2016 | 110.433.000.000 | 6.4% |
| 2017 | 72.653.000.000 | -52% |
| 2018 | 122.815.000.000 | 40.84% |
| 2019 | 194.771.000.000 | 36.94% |
| 2020 | 267.833.000.000 | 27.28% |
| 2021 | 288.044.000.000 | 7.02% |
| 2022 | 526.074.000.000 | 45.25% |
| 2023 | 374.452.000.000 | -40.49% |
| 2023 | 762.773.000.000 | 50.91% |
| 2024 | 626.716.000.000 | -21.71% |
Net income in stock investing is like the money a company actually gets to keep as profit after paying all its bills, and it's an important measure to understand how well a company is doing financially.
| Year | Net Profit | Growth |
|---|---|---|
| 2015 | 38.442.000.000 | |
| 2016 | 108.795.000.000 | 64.67% |
| 2017 | 138.527.000.000 | 21.46% |
| 2018 | 372.176.000.000 | 62.78% |
| 2019 | 189.998.000.000 | -95.88% |
| 2020 | 183.541.000.000 | -3.52% |
| 2021 | 140.773.000.000 | -30.38% |
| 2022 | 348.048.000.000 | 59.55% |
| 2023 | 211.584.000.000 | -64.5% |
| 2023 | 419.184.000.000 | 49.52% |
| 2024 | 584.472.000.000 | 28.28% |
EPS, or earnings per share, is a measure that shows how much profit a company has earned for each outstanding share of its stock, and it is important for stock investors as it helps understand the profitability of a company and compare it with other companies in the market.
| Year | Earning per Share (EPS) | Growth |
|---|---|---|
| 2015 | 148 | |
| 2016 | 419 | 64.68% |
| 2017 | 534 | 21.54% |
| 2018 | 1.435 | 62.79% |
| 2019 | 733 | -96.04% |
| 2020 | 708 | -3.39% |
| 2021 | 543 | -30.39% |
| 2022 | 1.342 | 59.54% |
| 2023 | 816 | -64.46% |
| 2023 | 1.616 | 49.5% |
| 2024 | 5 | -32220% |
Cashflow Statements
Cashflow statements show the movement of money in and out of a company, helping stock investors understand how much money a company makes and spends. By examining cashflow statements, investors can assess if a company is generating enough cash to pay its bills, invest in growth, and provide returns to stockholders.
Free cash flow is the leftover cash that a company generates after covering its operating expenses and capital expenditures, which is important for stock investors as it shows how much money a company has available to invest in growth, pay dividends, or reduce debt.
| Year | Free Cashflow | Growth |
|---|---|---|
| 2013 | -4.076.000.000 | |
| 2014 | 10.217.000.000 | 139.89% |
| 2015 | 24.404.000.000 | 58.13% |
| 2016 | 37.305.000.000 | 34.58% |
| 2017 | -12.433.000.000 | 400.05% |
| 2018 | -891.000.000 | -1295.4% |
| 2019 | 109.507.000.000 | 100.81% |
| 2020 | 126.127.000.000 | 13.18% |
| 2021 | 71.432.000.000 | -76.57% |
| 2022 | 209.394.000.000 | 65.89% |
| 2023 | -29.135.000.000 | 818.7% |
| 2023 | 323.177.000.000 | 109.02% |
| 2024 | -38.318.000.000 | 943.41% |
Operating cash flow represents the cash generated or consumed by a company's day-to-day operations, excluding external investing or financing activities, and is crucial for stock investors as it shows how much cash a company is generating from its core business operations.
| Year | Operating Cashflow | Growth |
|---|---|---|
| 2013 | 36.837.000.000 | |
| 2014 | 46.474.000.000 | 20.74% |
| 2015 | 49.135.000.000 | 5.42% |
| 2016 | 66.876.000.000 | 26.53% |
| 2017 | 23.355.000.000 | -186.35% |
| 2018 | 58.306.000.000 | 59.94% |
| 2019 | 159.522.000.000 | 63.45% |
| 2020 | 161.599.000.000 | 1.29% |
| 2021 | 118.726.000.000 | -36.11% |
| 2022 | 283.871.000.000 | 58.18% |
| 2023 | 0 | 0% |
| 2023 | 432.225.000.000 | 100% |
| 2024 | 0 | 0% |
Capex, short for capital expenditures, refers to the money a company spends on acquiring or upgrading tangible assets like buildings, equipment, or technology, which is important for stock investors as it indicates how much a company is investing in its infrastructure to support future growth and profitability.
| Year | Capital Expenditure | Growth |
|---|---|---|
| 2013 | 40.913.000.000 | |
| 2014 | 36.257.000.000 | -12.84% |
| 2015 | 24.731.000.000 | -46.61% |
| 2016 | 29.571.000.000 | 16.37% |
| 2017 | 35.788.000.000 | 17.37% |
| 2018 | 59.197.000.000 | 39.54% |
| 2019 | 50.015.000.000 | -18.36% |
| 2020 | 35.472.000.000 | -41% |
| 2021 | 47.294.000.000 | 25% |
| 2022 | 74.477.000.000 | 36.5% |
| 2023 | 29.135.000.000 | -155.63% |
| 2023 | 109.048.000.000 | 73.28% |
| 2024 | 38.318.000.000 | -184.59% |
Balance Sheet
Balance sheets provide a snapshot of a company's financial health and its assets (such as cash, inventory, and property) and liabilities (like debts and obligations) at a specific point in time. For stock investors, balance sheets help assess the company's overall worth and evaluate its ability to meet financial obligations and support future growth.
Equity refers to the ownership interest or stake that shareholders have in a company, representing their claim on its assets and earnings after all debts and liabilities are paid.
| Year | Equity | Growth |
|---|---|---|
| 2015 | 469.405.000.000 | |
| 2016 | 567.830.000.000 | 17.33% |
| 2017 | 641.176.000.000 | 11.44% |
| 2018 | 963.010.000.000 | 33.42% |
| 2019 | 1.242.154.000.000 | 22.47% |
| 2020 | 1.339.792.000.000 | 7.29% |
| 2021 | 1.537.101.000.000 | 12.84% |
| 2022 | 1.696.503.000.000 | 9.4% |
| 2023 | 2.008.267.000.000 | 15.52% |
| 2023 | 1.729.359.000.000 | -16.13% |
| 2024 | 1.896.250.000.000 | 8.8% |
Assets represent the valuable resources that a company owns, such as cash, inventory, property, and equipment, and understanding a company's assets helps investors assess its value and potential for generating future profits.
| Year | Assets | Growth |
|---|---|---|
| 2015 | 793.276.000.000 | |
| 2016 | 820.031.000.000 | 3.26% |
| 2017 | 938.032.000.000 | 12.58% |
| 2018 | 1.381.116.000.000 | 32.08% |
| 2019 | 1.674.133.000.000 | 17.5% |
| 2020 | 1.689.279.000.000 | 0.9% |
| 2021 | 1.951.504.000.000 | 13.44% |
| 2022 | 2.222.533.000.000 | 12.19% |
| 2023 | 2.599.292.000.000 | 14.49% |
| 2023 | 2.287.729.000.000 | -13.62% |
| 2024 | 2.511.172.000.000 | 8.9% |
Liabilities refer to the financial obligations or debts that a company owes to creditors or external parties, and understanding a company's liabilities is important for investors as it helps assess the company's financial risk and ability to meet its obligations.
| Year | Liabilities | Growth |
|---|---|---|
| 2015 | 323.871.000.000 | |
| 2016 | 252.201.000.000 | -28.42% |
| 2017 | 296.856.000.000 | 15.04% |
| 2018 | 418.106.000.000 | 29% |
| 2019 | 431.979.000.000 | 3.21% |
| 2020 | 349.487.000.000 | -23.6% |
| 2021 | 414.403.000.000 | 15.66% |
| 2022 | 526.030.000.000 | 21.22% |
| 2023 | 591.025.000.000 | 11% |
| 2023 | 558.370.000.000 | -5.85% |
| 2024 | 614.922.000.000 | 9.2% |
JSC National Atomic Company Kazatomprom Financial Ratio (TTM)
Valuation Metrics
- Revenue per Share
- 5849.12
- Net Income per Share
- 1665.51
- Price to Earning Ratio
- 10.68x
- Price To Sales Ratio
- 3.04x
- POCF Ratio
- 369.97
- PFCF Ratio
- -35.18
- Price to Book Ratio
- 3.28
- EV to Sales
- 3.03
- EV Over EBITDA
- 5.53
- EV to Operating CashFlow
- 368.3
- EV to FreeCashFlow
- -35.02
- Earnings Yield
- 0.09
- FreeCashFlow Yield
- -0.03
- Market Cap
- 4.611,34 Bil.
- Enterprise Value
- 4.590,50 Bil.
- Graham Number
- 14261.94
- Graham NetNet
- 554.59
Income Statement Metrics
- Net Income per Share
- 1665.51
- Income Quality
- 0.05
- ROE
- 0.3
- Return On Assets
- 0.17
- Return On Capital Employed
- 0.39
- Net Income per EBT
- 0.53
- EBT Per Ebit
- 1
- Ebit per Revenue
- 0.53
- Effective Tax Rate
- 0.21
Margins
- Sales, General, & Administrative to Revenue
- 0.01
- Research & Developement to Revenue
- 0
- Stock Based Compensation to Revenue
- 0
- Gross Profit Margin
- 0.48
- Operating Profit Margin
- 0.53
- Pretax Profit Margin
- 0.53
- Net Profit Margin
- 0.28
Dividends
- Dividend Yield
- 0.07
- Dividend Yield %
- 7.09
- Payout Ratio
- 0.73
- Dividend Per Share
- 2.59
Operating Metrics
- Operating Cashflow per Share
- 48.06
- Free CashFlow per Share
- -505.38
- Capex to Operating CashFlow
- 11.52
- Capex to Revenue
- 0.09
- Capex to Depreciation
- 2.54
- Return on Invested Capital
- 0.42
- Return on Tangible Assets
- 0.18
- Days Sales Outstanding
- 124.68
- Days Payables Outstanding
- 100.24
- Days of Inventory on Hand
- 184.82
- Receivables Turnover
- 2.93
- Payables Turnover
- 3.64
- Inventory Turnover
- 1.97
- Capex per Share
- 553.44
Balance Sheet
- Cash per Share
- 651,26
- Book Value per Share
- 7.311,35
- Tangible Book Value per Share
- 7080.36
- Shareholders Equity per Share
- 5427.85
- Interest Debt per Share
- 550.19
- Debt to Equity
- 0.09
- Debt to Assets
- 0.05
- Net Debt to EBITDA
- -0.03
- Current Ratio
- 2.62
- Tangible Asset Value
- 1.836,34 Bil.
- Net Current Asset Value
- 475,22 Bil.
- Invested Capital
- 1690695000000
- Working Capital
- 674,29 Bil.
- Intangibles to Total Assets
- 0.02
- Average Receivables
- 476,30 Bil.
- Average Payables
- 200,89 Bil.
- Average Inventory
- 408510500000
- Debt to Market Cap
- 0.03
Dividends
Dividends in stock investing are like rewards that companies give to their shareholders. They are a portion of the company's profits distributed to investors, typically in the form of cash payments, as a way for them to share in the company's success.
| Year | Dividends | Growth |
|---|---|---|
| 2019 | 1 | |
| 2020 | 1 | 0% |
| 2021 | 1 | 100% |
| 2022 | 2 | 0% |
| 2023 | 2 | 0% |
| 2024 | 3 | 50% |
JSC National Atomic Company Kazatomprom Profile
About JSC National Atomic Company Kazatomprom
JSC National Atomic Company Kazatomprom engages in the exploration, production, processing, marketing, and sale of uranium and uranium products in the Republic of Kazakhstan and internationally. It also processes rare metals; manufactures and sells beryllium, tantalum, and niobium products; provides communication and security services; and produces semiconductor materials. In addition, the company offers research, project, development, and engineering consulting services; drilling services; and procurement and transportation services, as well as monitors radiation level and environment conditions. Further, it is involved in the investment and administration of financial services. The company was founded in 1997 and is based in Nur-Sultan, the Republic of Kazakhstan.
- CEO
- Mr. Meirzhan Bakhitovich Yussu
- Employee
- 21.000
- Address
-
House 17/12, E-10 Street
Nur-Sultan, Z05T1X3
JSC National Atomic Company Kazatomprom Executives & BODs
| # | Name | Age |
|---|---|---|
| 1 |
Mr. Sultan Temirbayev Chief Financial Officer & Member of Management Board |
70 |
| 2 |
Botagoz Muldagaliyeva Director of Investor Relations |
70 |
| 3 |
Mr. Kuanysh Omarbekov Member of Management Board & Chief Operating Officer |
70 |
| 4 |
Zhussup Yeralin Acting Director of Corporation Fin. & Treasury |
70 |
| 5 |
Mr. Yermek Kuantyrov Chief Legal Support & Corporation Governance Officer and Member of the Management Board |
70 |
| 6 |
Mr. Meirzhan Bakhitovich Yussupov Chairman of the Management Board & Chief Executive Officer |
70 |
| 7 |
Mr. Dastan Kosherbayev Chief Commercial Officer & Member of Management Board |
70 |
| 8 |
Mr. Mukhit Magazhanov Chief Procurement & Gen. Affairs Officer and Member of the Management Board |
70 |
| 9 |
Mr. Alibek Aldongarov Chief HR & HSE Officer and Member of the Management Board |
70 |
| 10 |
S. J. Jakypbekova Chief Accountant |
70 |
JSC National Atomic Company Kazatomprom Competitors