RAND

Rand Capital Corporation
RAND
(2.2)19,85 USD
11.92% ROA
19.68% ROE
4x PER
43.235.182,00 USD
24.26% DER
8.72% Yield
127.97% NPM
Rand Capital Corporation Stock Analysis
Rand Capital Corporation Fundamental Analysis
Fundamental analysis in stock investing is like studying the foundation of a house before buying it. It involves looking at a company's financial health, like its earnings, assets, and debts, to determine if it's a good investment based on its fundamental strength and potential for growth.
| # | Analysis | Rating |
|---|---|---|
| 1 |
PBV
The stock's low PBV ratio (0.54x) suggests it's undervalued, making it an attractive opportunity for investors. |
|
| 2 |
DER
The stock has a low debt to equity ratio (17%), which means it has a small amount of debt compared to the ownership it holds |
|
| 3 |
ROE
The stock's ROE falls within an average range (10.58%), demonstrating satisfactory profitability and efficiency in utilizing shareholders' equity. |
|
| 4 |
ROA
The stock's ROA (8.24%) shows that it's doing a pretty good job at making money from its assets, making it a solid choice to invest and earn steady profits. |
|
| 5 |
Graham Number
The company's Graham number indicates that it is undervalued compared to its stock price, suggesting a potentially favorable investment opportunity. |
|
| 6 |
Dividend
Investors can take comfort in the fact that the company has consistently distributed dividends over the past three years, demonstrating a commitment to rewarding shareholders. |
|
| 7 |
Buffet Intrinsic Value
Based on Warren Buffett's formula, the company's stock appears undervalued (67), presenting an attractive investment chance with its intrinsic value surpassing the current market price. |
|
| 8 |
Revenue Growth
Company has experienced no growth in revenue over the past three years, suggesting limited profitability and making it a less desirable investment opportunity. |
|
| 9 |
Net Profit Growth
This company's net profit has remained stagnant over the past five years, indicating a lack of growth and making it a less favorable investment option. |
|
| 10 |
Assets Growth
Regrettably, this company's revenue has shown no signs of growth over the past three years, suggesting limited potential for returns and making it a less appealing choice. |
|
| 11 |
Dividend Growth
The company's dividend growth has remained flat for the past three years, offering no indication of improved returns and making it a less advantageous investment opportunity. |
Rand Capital Corporation Technical Analysis
Technical analysis in stock investing is like reading the patterns on a weather map to predict future weather conditions. It involves studying past stock price movements and trading volumes to make predictions about where a stock's price might go next, without necessarily looking at the company's financial health.
| # | Analysis | Recommendation |
|---|---|---|
| 1 | Awesome Oscillator | Buy |
| 2 | MACD | Buy |
| 3 | RSI | Hold |
| 4 | Stoch RSI | Sell |
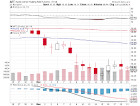
Rand Capital Corporation Price Chart
Financial Statements
Financial statements are like report cards for companies. They show how much money a company makes (income statement), what it owns and owes (balance sheet), and where it spends its money (cash flow statement), helping stock investors understand if a company is healthy and worth investing in.
Income Statements
An income statement for a company is like a scoreboard for its profits and losses. It shows how much money the company made (revenue) and how much it spent to make that money (expenses), helping stock investors see if a company is making a profit or not.
Revenue in stock investing is the total amount of money a company earns from its sales, and it's a key factor that investors consider to assess a company's financial performance and growth potential.
| Year | Revenue | Growth |
|---|---|---|
| 1994 | 300.000 | |
| 1996 | 170.000 | -76.47% |
| 1997 | 460.000 | 63.04% |
| 1998 | 590.000 | 22.03% |
| 1999 | 360.000 | -63.89% |
| 2000 | 240.000 | -50% |
| 2001 | 160.000 | -50% |
| 2002 | 260.000 | 38.46% |
| 2003 | 450.000 | 42.22% |
| 2004 | 760.000 | 40.79% |
| 2005 | 740.000 | -2.7% |
| 2006 | 14.268.930 | 94.81% |
| 2007 | 5.252.881 | -171.64% |
| 2008 | 1.508.395 | -248.24% |
| 2009 | 202.358 | -645.41% |
| 2010 | 272.568 | 25.76% |
| 2011 | 739.033 | 63.12% |
| 2012 | 4.150.149 | 82.19% |
| 2013 | 5.495.757 | 24.48% |
| 2014 | 8.258.125 | 33.45% |
| 2015 | 3.682.099 | -124.28% |
| 2016 | 1.031.858 | -256.84% |
| 2017 | 996.039 | -3.6% |
| 2018 | 986.730 | -0.94% |
| 2019 | 2.724.696 | 63.79% |
| 2020 | 3.040.220 | 10.38% |
| 2021 | 20.790.849 | 85.38% |
| 2022 | 5.765.181 | -260.63% |
| 2023 | 3.915.616 | -47.24% |
| 2023 | 7.338.163 | 46.64% |
| 2024 | 10.257.028 | 28.46% |
Research and Development Expenses are the costs a company incurs to create and improve its products or services, which can be important for investors to evaluate a company's innovation and potential for future growth.
| Year | Research and Development Expenses | Growth |
|---|---|---|
| 1994 | 0 | |
| 1996 | 0 | 0% |
| 1997 | 0 | 0% |
| 1998 | 0 | 0% |
| 1999 | 0 | 0% |
| 2000 | 0 | 0% |
| 2001 | 0 | 0% |
| 2002 | 0 | 0% |
| 2003 | 0 | 0% |
| 2004 | 0 | 0% |
| 2005 | 0 | 0% |
| 2006 | 0 | 0% |
| 2007 | 0 | 0% |
| 2008 | 65.042 | 100% |
| 2009 | 55.749 | -16.67% |
| 2010 | 0 | 0% |
| 2011 | 0 | 0% |
| 2012 | 0 | 0% |
| 2013 | 0 | 0% |
| 2014 | 64.490 | 100% |
| 2015 | 0 | 0% |
| 2016 | 0 | 0% |
| 2017 | 0 | 0% |
| 2018 | -1 | 100% |
| 2019 | -1 | 0% |
| 2020 | -1 | 0% |
| 2021 | 2 | 100% |
| 2022 | 0 | 0% |
| 2023 | 0 | 0% |
| 2023 | 0 | 0% |
| 2024 | 0 | 0% |
General and Administrative Expenses are the costs a company incurs to run its day-to-day operations, such as office rent, salaries, and utilities, which investors consider to understand a company's overall efficiency and management effectiveness.
| Year | General and Administrative Expenses | Growth |
|---|---|---|
| 1994 | 400.000 | |
| 1996 | 730.000 | 45.21% |
| 1997 | 730.000 | 0% |
| 1998 | 720.000 | -1.39% |
| 1999 | 710.000 | -1.41% |
| 2000 | 600.000 | -18.33% |
| 2001 | 720.000 | 16.67% |
| 2002 | 710.000 | -1.41% |
| 2003 | 900.000 | 21.11% |
| 2004 | 780.000 | -15.38% |
| 2005 | 980.000 | 20.41% |
| 2006 | 583.852 | -67.85% |
| 2007 | 573.064 | -1.88% |
| 2008 | 800.995 | 28.46% |
| 2009 | 1.017.103 | 21.25% |
| 2010 | 1.621.681 | 37.28% |
| 2011 | 956.515 | -69.54% |
| 2012 | 583.670 | -63.88% |
| 2013 | 428.310 | -36.27% |
| 2014 | 536.371 | 20.15% |
| 2015 | 671.594 | 20.13% |
| 2016 | 909.164 | 26.13% |
| 2017 | 866.273 | -4.95% |
| 2018 | 883.355 | 1.93% |
| 2019 | 1.351.747 | 34.65% |
| 2020 | 968.699 | -39.54% |
| 2021 | 5.194.901 | 81.35% |
| 2022 | 122.043 | -4156.62% |
| 2023 | 1.003.220 | 87.83% |
| 2023 | 1.271.622 | 21.11% |
| 2024 | 1.183.752 | -7.42% |
EBITDA stands for Earnings Before Interest, Taxes, Depreciation, and Amortization. It is a measure that helps stock investors analyze a company's profitability by looking at its earnings without considering certain expenses. This helps to get a clearer picture of the company's financial performance and its ability to generate cash flow.
| Year | EBITDA | Growth |
|---|---|---|
| 1994 | 0 | |
| 1996 | -5.550.000 | 100% |
| 1997 | -390.000 | -1323.08% |
| 1998 | -260.000 | -50% |
| 1999 | -850.000 | 69.41% |
| 2000 | 2.700.000 | 131.48% |
| 2001 | 5.680.000 | 52.46% |
| 2002 | -820.000 | 792.68% |
| 2003 | -760.000 | -7.89% |
| 2004 | -20.811 | -3551.91% |
| 2005 | -228.689 | 90.9% |
| 2006 | 0 | 0% |
| 2007 | 0 | 0% |
| 2008 | 610.557 | 100% |
| 2009 | 0 | 0% |
| 2010 | 0 | 0% |
| 2011 | 0 | 0% |
| 2012 | 0 | 0% |
| 2013 | 0 | 0% |
| 2014 | 0 | 0% |
| 2015 | 0 | 0% |
| 2016 | -1.439.517 | 100% |
| 2017 | -350.955 | -310.17% |
| 2018 | -273.919 | -28.12% |
| 2019 | -543.243 | 49.58% |
| 2020 | -399.704 | -35.91% |
| 2021 | 85.115 | 569.6% |
| 2022 | 0 | 0% |
| 2023 | -243.036 | 100% |
| 2023 | 8.252.838 | 102.94% |
| 2024 | 32.551.040 | 74.65% |
Gross profit is the money a company makes from selling its products or services after subtracting the cost of producing or providing them, and it is an important measure for investors to understand a company's profitability.
| Year | Gross Profit | Growth |
|---|---|---|
| 1994 | 300.000 | |
| 1996 | 170.000 | -76.47% |
| 1997 | 460.000 | 63.04% |
| 1998 | 590.000 | 22.03% |
| 1999 | 360.000 | -63.89% |
| 2000 | 240.000 | -50% |
| 2001 | 160.000 | -50% |
| 2002 | 260.000 | 38.46% |
| 2003 | 450.000 | 42.22% |
| 2004 | 650.000 | 30.77% |
| 2005 | 460.000 | -41.3% |
| 2006 | 14.268.930 | 96.78% |
| 2007 | 5.252.881 | -171.64% |
| 2008 | 1.508.395 | -248.24% |
| 2009 | 202.358 | -645.41% |
| 2010 | 272.568 | 25.76% |
| 2011 | 739.033 | 63.12% |
| 2012 | 4.150.149 | 82.19% |
| 2013 | 5.472.357 | 24.16% |
| 2014 | 8.234.225 | 33.54% |
| 2015 | 3.659.761 | -124.99% |
| 2016 | -77.474 | 4823.86% |
| 2017 | 964.606 | 108.03% |
| 2018 | 957.044 | -0.79% |
| 2019 | -1.478.794 | 164.72% |
| 2020 | 2.413.026 | 161.28% |
| 2021 | 15.557.293 | 84.49% |
| 2022 | -2.535.126 | 713.67% |
| 2023 | 3.687.228 | 168.75% |
| 2023 | 5.302.297 | 30.46% |
| 2024 | 2.217.340 | -139.13% |
Net income in stock investing is like the money a company actually gets to keep as profit after paying all its bills, and it's an important measure to understand how well a company is doing financially.
| Year | Net Profit | Growth |
|---|---|---|
| 1994 | -400.000 | |
| 1996 | -2.870.000 | 86.06% |
| 1997 | -340.000 | -744.12% |
| 1998 | -100.000 | -240% |
| 1999 | -630.000 | 84.13% |
| 2000 | 720.000 | 187.5% |
| 2001 | 1.640.000 | 56.1% |
| 2002 | -430.000 | 481.4% |
| 2003 | -340.000 | -26.47% |
| 2004 | -210.000 | -61.9% |
| 2005 | -410.000 | 48.78% |
| 2006 | 8.166.471 | 105.02% |
| 2007 | 2.719.165 | -200.33% |
| 2008 | 409.143 | -564.6% |
| 2009 | -739.420 | 155.33% |
| 2010 | -155.063 | -376.85% |
| 2011 | 1.348.303 | 111.5% |
| 2012 | 1.939.767 | 30.49% |
| 2013 | 2.873.357 | 32.49% |
| 2014 | 4.541.481 | 36.73% |
| 2015 | 1.500.219 | -202.72% |
| 2016 | -1.202.683 | 224.74% |
| 2017 | -710.678 | -69.23% |
| 2018 | -394.498 | -80.15% |
| 2019 | -2.289.670 | 82.77% |
| 2020 | 743.766 | 407.85% |
| 2021 | 15.797.428 | 95.29% |
| 2022 | -881.849 | 1891.4% |
| 2023 | 2.382.016 | 137.02% |
| 2023 | 6.526.650 | 63.5% |
| 2024 | 30.951.092 | 78.91% |
EPS, or earnings per share, is a measure that shows how much profit a company has earned for each outstanding share of its stock, and it is important for stock investors as it helps understand the profitability of a company and compare it with other companies in the market.
| Year | Earning per Share (EPS) | Growth |
|---|---|---|
| 1994 | -1 | |
| 1996 | -1 | 0% |
| 1997 | 0 | 0% |
| 1998 | 0 | 0% |
| 1999 | 0 | 0% |
| 2000 | 0 | 0% |
| 2001 | 0 | 0% |
| 2002 | 0 | 0% |
| 2003 | 0 | 0% |
| 2004 | 0 | 0% |
| 2005 | 0 | 0% |
| 2006 | 13 | 100% |
| 2007 | 4 | -200% |
| 2008 | 1 | 0% |
| 2009 | -1 | 100% |
| 2010 | 0 | 0% |
| 2011 | 2 | 100% |
| 2012 | 3 | 50% |
| 2013 | 4 | 33.33% |
| 2014 | 6 | 50% |
| 2015 | 2 | -200% |
| 2016 | -2 | 300% |
| 2017 | -1 | 0% |
| 2018 | -1 | 0% |
| 2019 | -3 | 100% |
| 2020 | 0 | 0% |
| 2021 | 6 | 100% |
| 2022 | 0 | 0% |
| 2023 | 1 | 0% |
| 2023 | 3 | 100% |
| 2024 | 12 | 83.33% |
Cashflow Statements
Cashflow statements show the movement of money in and out of a company, helping stock investors understand how much money a company makes and spends. By examining cashflow statements, investors can assess if a company is generating enough cash to pay its bills, invest in growth, and provide returns to stockholders.
Free cash flow is the leftover cash that a company generates after covering its operating expenses and capital expenditures, which is important for stock investors as it shows how much money a company has available to invest in growth, pay dividends, or reduce debt.
| Year | Free Cashflow | Growth |
|---|---|---|
| 1994 | -400.000 | |
| 1999 | -440.000 | 9.09% |
| 2000 | 110.000 | 500% |
| 2001 | -750.000 | 114.67% |
| 2002 | -700.000 | -7.14% |
| 2003 | -580.000 | -20.69% |
| 2004 | -190.000 | -205.26% |
| 2005 | -610.000 | 68.85% |
| 2006 | -325.000 | -87.69% |
| 2007 | -449.000 | 27.62% |
| 2008 | -725.750 | 38.13% |
| 2009 | -427.955 | -69.59% |
| 2010 | -3.331.677 | 87.15% |
| 2011 | 641.645 | 619.24% |
| 2012 | 3.058.772 | 79.02% |
| 2013 | -515.703 | 693.13% |
| 2014 | -1.364.445 | 62.2% |
| 2015 | -2.381.348 | 42.7% |
| 2016 | 6.456.959 | 136.88% |
| 2017 | -6.018.101 | 207.29% |
| 2018 | -2.900.059 | -107.52% |
| 2019 | 4.741.987 | 161.16% |
| 2020 | -616.970 | 868.59% |
| 2021 | -3.940.583 | 84.34% |
| 2022 | 252.368 | 1661.44% |
| 2023 | -7.331.374 | 103.44% |
| 2023 | 6.117.131 | 219.85% |
| 2024 | -101.060 | 6152.97% |
Operating cash flow represents the cash generated or consumed by a company's day-to-day operations, excluding external investing or financing activities, and is crucial for stock investors as it shows how much cash a company is generating from its core business operations.
| Year | Operating Cashflow | Growth |
|---|---|---|
| 1994 | -400.000 | |
| 1999 | -410.000 | 2.44% |
| 2000 | 110.000 | 472.73% |
| 2001 | -740.000 | 114.86% |
| 2002 | -690.000 | -7.25% |
| 2003 | -580.000 | -18.97% |
| 2004 | -180.000 | -222.22% |
| 2005 | -610.000 | 70.49% |
| 2006 | -313.000 | -94.89% |
| 2007 | -448.000 | 30.13% |
| 2008 | -713.528 | 37.21% |
| 2009 | -427.955 | -66.73% |
| 2010 | -3.330.831 | 87.15% |
| 2011 | 641.645 | 619.11% |
| 2012 | 3.058.772 | 79.02% |
| 2013 | -508.156 | 701.94% |
| 2014 | -1.353.146 | 62.45% |
| 2015 | -2.378.579 | 43.11% |
| 2016 | 6.457.796 | 136.83% |
| 2017 | -6.018.101 | 207.31% |
| 2018 | -2.900.059 | -107.52% |
| 2019 | 4.741.987 | 161.16% |
| 2020 | -616.970 | 868.59% |
| 2021 | -3.940.583 | 84.34% |
| 2022 | 252.368 | 1661.44% |
| 2023 | -7.331.374 | 103.44% |
| 2023 | 6.117.131 | 219.85% |
| 2024 | -101.060 | 6152.97% |
Capex, short for capital expenditures, refers to the money a company spends on acquiring or upgrading tangible assets like buildings, equipment, or technology, which is important for stock investors as it indicates how much a company is investing in its infrastructure to support future growth and profitability.
| Year | Capital Expenditure | Growth |
|---|---|---|
| 1994 | 0 | |
| 1999 | 30.000 | 100% |
| 2000 | 0 | 0% |
| 2001 | 10.000 | 100% |
| 2002 | 10.000 | 0% |
| 2003 | 0 | 0% |
| 2004 | 10.000 | 100% |
| 2005 | 0 | 0% |
| 2006 | 12.000 | 100% |
| 2007 | 1.000 | -1100% |
| 2008 | 12.222 | 91.82% |
| 2009 | 0 | 0% |
| 2010 | 846 | 100% |
| 2011 | 0 | 0% |
| 2012 | 0 | 0% |
| 2013 | 7.547 | 100% |
| 2014 | 11.299 | 33.21% |
| 2015 | 2.769 | -308.05% |
| 2016 | 837 | -230.82% |
| 2017 | 0 | 0% |
| 2018 | 0 | 0% |
| 2019 | 0 | 0% |
| 2020 | 0 | 0% |
| 2021 | 0 | 0% |
| 2022 | 0 | 0% |
| 2023 | 0 | 0% |
| 2023 | 0 | 0% |
| 2024 | 0 | 0% |
Balance Sheet
Balance sheets provide a snapshot of a company's financial health and its assets (such as cash, inventory, and property) and liabilities (like debts and obligations) at a specific point in time. For stock investors, balance sheets help assess the company's overall worth and evaluate its ability to meet financial obligations and support future growth.
Equity refers to the ownership interest or stake that shareholders have in a company, representing their claim on its assets and earnings after all debts and liabilities are paid.
| Year | Equity | Growth |
|---|---|---|
| 1994 | 13.400.000 | |
| 1996 | 6.460.000 | -107.43% |
| 1997 | 8.340.000 | 22.54% |
| 1998 | 8.240.000 | -1.21% |
| 1999 | 7.610.000 | -8.28% |
| 2000 | 8.390.000 | 9.3% |
| 2001 | 10.060.000 | 16.6% |
| 2002 | 9.600.000 | -4.79% |
| 2003 | 9.240.000 | -3.9% |
| 2004 | 9.030.000 | -2.33% |
| 2005 | 8.620.000 | -4.76% |
| 2006 | 16.782.000 | 48.64% |
| 2007 | 19.818.000 | 15.32% |
| 2008 | 20.226.966 | 2.02% |
| 2009 | 23.205.881 | 12.84% |
| 2010 | 23.050.818 | -0.67% |
| 2011 | 24.399.121 | 5.53% |
| 2012 | 25.782.300 | 5.36% |
| 2013 | 28.069.332 | 8.15% |
| 2014 | 32.353.441 | 13.24% |
| 2015 | 33.853.660 | 4.43% |
| 2016 | 28.176.996 | -20.15% |
| 2017 | 33.511.819 | 15.92% |
| 2018 | 36.044.838 | 7.03% |
| 2019 | 38.599.709 | 6.62% |
| 2020 | 36.564.002 | -5.57% |
| 2021 | 59.911.541 | 38.97% |
| 2022 | 58.902.324 | -1.71% |
| 2023 | 73.769.892 | 20.15% |
| 2023 | 61.352.277 | -20.24% |
| 2024 | 68.558.616 | 10.51% |
Assets represent the valuable resources that a company owns, such as cash, inventory, property, and equipment, and understanding a company's assets helps investors assess its value and potential for generating future profits.
| Year | Assets | Growth |
|---|---|---|
| 1994 | 16.300.000 | |
| 1996 | 6.610.000 | -146.6% |
| 1997 | 8.450.000 | 21.78% |
| 1998 | 8.310.000 | -1.68% |
| 1999 | 7.650.000 | -8.63% |
| 2000 | 8.450.000 | 9.47% |
| 2001 | 10.290.000 | 17.88% |
| 2002 | 9.680.000 | -6.3% |
| 2003 | 9.390.000 | -3.09% |
| 2004 | 12.750.000 | 26.35% |
| 2005 | 16.070.000 | 20.66% |
| 2006 | 29.464.000 | 45.46% |
| 2007 | 32.722.000 | 9.96% |
| 2008 | 32.228.797 | -1.53% |
| 2009 | 35.631.371 | 9.55% |
| 2010 | 35.091.260 | -1.54% |
| 2011 | 31.331.957 | -12% |
| 2012 | 34.252.413 | 8.53% |
| 2013 | 39.750.370 | 13.83% |
| 2014 | 45.525.987 | 12.69% |
| 2015 | 44.761.687 | -1.71% |
| 2016 | 42.418.530 | -5.52% |
| 2017 | 40.133.913 | -5.69% |
| 2018 | 40.521.724 | 0.96% |
| 2019 | 64.791.449 | 37.46% |
| 2020 | 60.966.942 | -6.27% |
| 2021 | 65.644.854 | 7.13% |
| 2022 | 63.481.192 | -3.41% |
| 2023 | 81.021.982 | 21.65% |
| 2023 | 79.039.682 | -2.51% |
| 2024 | 90.789.069 | 12.94% |
Liabilities refer to the financial obligations or debts that a company owes to creditors or external parties, and understanding a company's liabilities is important for investors as it helps assess the company's financial risk and ability to meet its obligations.
| Year | Liabilities | Growth |
|---|---|---|
| 1994 | 100.000 | |
| 1996 | 150.000 | 33.33% |
| 1997 | 110.000 | -36.36% |
| 1998 | 70.000 | -57.14% |
| 1999 | 40.000 | -75% |
| 2000 | 60.000 | 33.33% |
| 2001 | 230.000 | 73.91% |
| 2002 | 80.000 | -187.5% |
| 2003 | 150.000 | 46.67% |
| 2004 | 3.720.000 | 95.97% |
| 2005 | 7.450.000 | 50.07% |
| 2006 | 12.682.000 | 41.26% |
| 2007 | 12.904.000 | 1.72% |
| 2008 | 12.001.831 | -7.52% |
| 2009 | 12.425.490 | 3.41% |
| 2010 | 12.040.442 | -3.2% |
| 2011 | 6.932.836 | -73.67% |
| 2012 | 8.470.113 | 18.15% |
| 2013 | 11.681.038 | 27.49% |
| 2014 | 13.172.546 | 11.32% |
| 2015 | 10.908.027 | -20.76% |
| 2016 | 9.789.167 | -11.43% |
| 2017 | 8.215.228 | -19.16% |
| 2018 | 8.997.537 | 8.69% |
| 2019 | 11.162.933 | 19.4% |
| 2020 | 14.862.112 | 24.89% |
| 2021 | 51.689 | -28652.95% |
| 2022 | 5.759.872 | 99.1% |
| 2023 | 20.206.769 | 71.5% |
| 2023 | 17.687.405 | -14.24% |
| 2024 | 22.230.453 | 20.44% |
Rand Capital Corporation Financial Ratio (TTM)
Valuation Metrics
- Revenue per Share
- 4.25
- Net Income per Share
- 4.19
- Price to Earning Ratio
- 4x
- Price To Sales Ratio
- 3.94x
- POCF Ratio
- -15.65
- PFCF Ratio
- -15.65
- Price to Book Ratio
- 0.63
- EV to Sales
- 5.3
- EV Over EBITDA
- 5.08
- EV to Operating CashFlow
- -21.05
- EV to FreeCashFlow
- -21.05
- Earnings Yield
- 0.25
- FreeCashFlow Yield
- -0.06
- Market Cap
- 0,04 Bil.
- Enterprise Value
- 0,06 Bil.
- Graham Number
- 50.06
- Graham NetNet
- -7.45
Income Statement Metrics
- Net Income per Share
- 4.19
- Income Quality
- -0.26
- ROE
- 0.17
- Return On Assets
- 0.16
- Return On Capital Employed
- 0.14
- Net Income per EBT
- 1.14
- EBT Per Ebit
- 0.99
- Ebit per Revenue
- 1.13
- Effective Tax Rate
- 0.01
Margins
- Sales, General, & Administrative to Revenue
- 0.13
- Research & Developement to Revenue
- 0
- Stock Based Compensation to Revenue
- 0
- Gross Profit Margin
- 0.71
- Operating Profit Margin
- 1.13
- Pretax Profit Margin
- 1.12
- Net Profit Margin
- 1.28
Dividends
- Dividend Yield
- 0.09
- Dividend Yield %
- 8.72
- Payout Ratio
- 0.34
- Dividend Per Share
- 1.46
Operating Metrics
- Operating Cashflow per Share
- -1.07
- Free CashFlow per Share
- -1.07
- Capex to Operating CashFlow
- 0
- Capex to Revenue
- 0
- Capex to Depreciation
- 0
- Return on Invested Capital
- 0.13
- Return on Tangible Assets
- 0.12
- Days Sales Outstanding
- 31.52
- Days Payables Outstanding
- 13.54
- Days of Inventory on Hand
- 0
- Receivables Turnover
- 11.58
- Payables Turnover
- 26.96
- Inventory Turnover
- 2921128
- Capex per Share
- 0
Balance Sheet
- Cash per Share
- 0,89
- Book Value per Share
- 26,56
- Tangible Book Value per Share
- 26.56
- Shareholders Equity per Share
- 26.56
- Interest Debt per Share
- 6.99
- Debt to Equity
- 0.24
- Debt to Assets
- 0.18
- Net Debt to EBITDA
- 1.3
- Current Ratio
- 0.66
- Tangible Asset Value
- 0,07 Bil.
- Net Current Asset Value
- -0,02 Bil.
- Invested Capital
- -1504324
- Working Capital
- 0,00 Bil.
- Intangibles to Total Assets
- 0
- Average Receivables
- 0,00 Bil.
- Average Payables
- 0,00 Bil.
- Average Inventory
- 1
- Debt to Market Cap
- 0.38
Dividends
Dividends in stock investing are like rewards that companies give to their shareholders. They are a portion of the company's profits distributed to investors, typically in the form of cash payments, as a way for them to share in the company's success.
| Year | Dividends | Growth |
|---|---|---|
| 2020 | 2 | |
| 2021 | 0 | 0% |
| 2022 | 1 | 0% |
| 2023 | 1 | 100% |
| 2024 | 1 | 0% |
Rand Capital Corporation Profile
About Rand Capital Corporation
Rand Capital Corporation is a business development company and regulated investment company specializing in private equity investments. The firm prefers to make investments through equity or debt instruments in lower middle market and in small to medium-sized privately held companies. It generally lends to more mature companies. The firm does not prefer to invest in real estate sector. It invests in companies that are engaged in the exploitation of new or unique products, technologies, or services. The firm invests in healthcare, consumer products, manufacturing, software, and professional services. It seeks to invest in companies based in the Western and Upstate New York region and its surrounding states with focus on Buffalo and Niagara region. The firm may invest in region within three to five hour drives from Western New York including Canada. It typically invests between $0.5 million and $1.5 million and the total investment in rounds is between $1 million and $5 million. The firm seeks to invest up to maximum of $3 million total per company as part of follow-on investments. It invest in startups and companies having annual revenue up to $10 million. It invest companies having EBITDA up to $5 million. The firm Follow-on investment(s) up to a targeted maximum of $2 million to $3 million total per company. The firm frequently participate three investment round. The firm seeks to be a lead investor in companies within its geographical area and participates in syndicate/co-invest with other investors outside it. It prefers to invest in businesses that are unique or possess proprietary right. The firm prefers to be a minority investor and seeks to take a Board seat in its portfolio companies. It typically holds its investments for a period of five to seven years. Rand Capital Corporation was founded in 1969 and is based in Buffalo, New York.
- CEO
- Mr. Daniel Patrick Penberthy
- Employee
- 4
- Address
-
14 Lafayette Square
Buffalo, 14203
Rand Capital Corporation Executives & BODs
| # | Name | Age |
|---|---|---|
| 1 |
Ms. Deborah Kay Pawlowski Investor Relations |
70 |
| 2 |
Mr. Daniel Patrick Penberthy President & Chief Executive Officer |
70 |
| 3 |
Ms. Margaret Whalen Brechtel CPA Executive Vice President, Treasurer, Chief Financial Officer & Secretary |
70 |
| 4 |
Ms. Heather Eastgate Chief Compliance Officer |
70 |
Rand Capital Corporation Competitors