

 ST
STIM.US Neuronetics Inc
- Market cap
- USD 123M
- P/E
- -
- P/B
- 6.47x
- ROE
- -113.5%
- Dividend yield
- -
- Fundamental score
- -
Ratios use the latest price and the current fiscal year annualized from 3 quarters up to Sep 2026.
Is STIM.US undervalued?
Graham numberThe Graham number of Neuronetics Inc cannot be estimated reliably (it needs positive earnings and book value).
Graham number = √(22.5 × EPS × book value per share): the most a defensive investor should pay according to Benjamin Graham. An estimate, not a recommendation to buy or sell. How is it calculated?
Neuronetics Inc fundamental analysis
No fundamental analysis for Neuronetics Inc yet.
Neuronetics Inc stock price
Prices on the chart can differ slightly from the closing prices StockSummer uses for its ratios.
About Neuronetics Inc
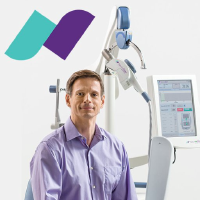
Neuronetics, Inc. engages in providing in office treatments for patients with neurohealth disorders in the United States and internationally. The company provides NeuroStar Advanced Therapy System, a non-invasive and non-systemic office-based treatment to treat adult patients with major depressive disorder. Its NeuroStar Advanced Therapy System uses transcranial magnetic stimulation to create a pulsed, MRI-strength magnetic field that induces electrical currents designed to …
Full company profileNeuronetics Inc financial statements
2026 annualized: Fiscal year 2026 is not finished. Income statement and cash flow are annualized from 3 quarters up to Sep 30, 2026, the balance sheet is the latest quarter. Figures change when the annual report is published.
Neuronetics Inc annual financial statements (USD; K = thousand, M = million, B = billion, T = trillion)
| Item | 2016 | 2017 | 2018 | 2019 | 2020 | 2021 | 2022 | 2023 | 2024 | 2025 | 2026 Anlz |
|---|---|---|---|---|---|---|---|---|---|---|---|
| Income Statement | |||||||||||
| Revenue | 34.2M | 40.4M | 52.8M | 62.7M | 49.2M | 55.3M | 65.2M | 71.3M | 74.9M | 149M | 157M |
| Gross Profit | 27.6M | 30.8M | 40.3M | 47.3M | 37.7M | 43.7M | 49.7M | 51.7M | 54.2M | 72.3M | 79.0M |
| Operating Income | -9.34M | -13.6M | -19.8M | -26.9M | -22.3M | -27.6M | -35.1M | -30.6M | -34.6M | -31.4M | -13.3M |
| EBITDA | -8.73M | -12.7M | -19.5M | -27.2M | -25.9M | -26.8M | -32.0M | -22.8M | -34.4M | -27.1M | -10.3M |
| Net Income | -11.2M | -16.1M | -24.1M | -29.0M | -27.5M | -31.2M | -37.2M | -30.2M | -43.7M | -39.0M | -21.2M |
| EPS | -1,001 | -1,431 | -2.69 | -1.58 | -1.46 | -1.22 | -1.38 | -1.05 | -1.38 | -0.59 | -0.28 |
| Balance Sheet | |||||||||||
| Total Assets | 24.8M | 38.9M | 117M | 100M | 78.7M | 141M | 117M | 116M | 141M | 142M | 132M |
| Total Liabilities | 202M | 232M | 46.0M | 52.3M | 53.2M | 56.0M | 59.8M | 81.6M | 109M | 115M | 110M |
| Shareholders' Equity | -177M | -193M | 71.0M | 47.9M | 25.5M | 85.2M | 57.1M | 34.2M | 27.7M | 22.4M | 18.7M |
| Cash & Short-term Investments | 17.0M | 29.1M | 105M | 76.6M | 50.8M | 96.3M | 71.9M | 60.6M | 19.7M | 34.4M | 22.1M |
| Total Debt | 20.6M | 59.6M | 30.4M | 34.3M | 38.3M | 39.5M | 39.7M | 62.5M | 82.6M | 90.3M | 87.7M |
| Cash Flow | |||||||||||
| Operating Cash Flow | -8.54M | -11.1M | -20.6M | -30.5M | -28.4M | -28.0M | -30.7M | -32.0M | -31.0M | -20.4M | -10.7M |
| Capital Expenditure | 324K | 594K | 1.01M | 813K | 730K | 2.35M | 3.27M | 2.37M | 1.47M | 801K | 1.45M |
| Free Cash Flow | -8.87M | -11.7M | -21.6M | -31.3M | -29.1M | -30.3M | -34.0M | -34.4M | -32.5M | -21.2M | -12.1M |
| Ratios | |||||||||||
| ROE | - | - | -33.9% | -60.7% | -107.7% | -36.6% | -65.1% | -88.3% | -157.8% | -174.3% | -113.5% |
| ROA | -45.3% | -41.2% | -20.6% | -29.0% | -34.9% | -22.1% | -31.8% | -26.1% | -31.0% | -27.6% | -16.1% |
| Net Profit Margin | -32.8% | -39.7% | -45.7% | -46.4% | -55.7% | -56.4% | -57.0% | -42.3% | -58.4% | -26.1% | -13.5% |
| Debt to Equity | - | - | 0.43x | 0.72x | 1.50x | 0.46x | 0.70x | 1.83x | 2.98x | 4.04x | 4.69x |
What these items mean
- Revenue
- Total sales of goods and services in the period.
- Gross Profit
- Revenue minus the direct cost of producing what was sold.
- Operating Income
- Profit from the core business after operating expenses.
- EBITDA
- Earnings before interest, taxes, depreciation and amortization.
- Net Income
- Profit left for shareholders after all expenses, interest and taxes.
- EPS
- Net income divided by shares outstanding.
- Total Assets
- Everything the company owns.
- Total Liabilities
- Everything the company owes.
- Shareholders' Equity
- Assets minus liabilities: the book value that belongs to shareholders.
- Cash & Short-term Investments
- Cash and investments that can be turned into cash quickly.
- Total Debt
- Short and long-term borrowings.
- Operating Cash Flow
- Cash generated by the core business.
- Capital Expenditure
- Cash spent on property, plant and equipment.
- Free Cash Flow
- Operating cash flow minus capital expenditure: cash left for dividends, buybacks or debt repayment.
- ROE
- Return on equity: net income divided by shareholders' equity.
- ROA
- Return on assets: net income divided by total assets.
- Net Profit Margin
- Net income as a share of revenue.
- Debt to Equity
- Total debt divided by shareholders' equity.
Neuronetics Inc dividends
Neuronetics Inc has not paid dividends in the last 9 fiscal years.
Who owns Neuronetics Inc
- Insiders 22.55%
- Institutions 46.14%
- Public & others 31.31%
- Shares outstanding 96.5M
- Free float 42.0M
Top funds holding STIM.US
| Holder | Shares | % of shares | Change | As of |
|---|---|---|---|---|
| Vanguard MStar Total Stk Mkt Idx Invest | 1.06M | 1.36% | 0.00% | Sep 2026 |
| AdvisorShares Psychedelics ETF | 909K | 1.17% | +5.82% | Oct 2026 |
| Fidelity Nasdaq Composite Index | 220K | 0.28% | +392.08% | Aug 2026 |
| Fidelity Extended Market Index | 182K | 0.23% | -15.90% | Sep 2026 |
| EA Bridgeway Ultra-Small Company Mkt ETF | 90.3K | 0.12% | 0.00% | Oct 2026 |
| Goldman Sachs Absolute Ret Trckr Instl | 87.1K | 0.11% | +119.24% | Jun 2026 |
| iShares Micro-Cap ETF | 86.0K | 0.11% | 0.00% | Oct 2026 |
| LUX IM Global Medtech HX | 79.3K | 0.10% | 0.00% | Oct 2026 |
| 1290 VT GAMCO Small Company Value IB | 75.0K | 0.10% | 0.00% | Sep 2026 |
| Fidelity Total Market Index | 70.5K | 0.09% | -0.05% | Sep 2026 |
| Fidelity Series Total Market Index | 58.7K | 0.08% | 0.00% | Sep 2026 |
| Invesco NASDAQ Future Gen 200 ETF | 41.4K | 0.05% | +1.92% | Oct 2026 |
| AQR Small Cap Momentum Style I | 36.5K | 0.05% | 0.00% | Mar 2026 |
| Gabelli Small Cap Growth AAA | 30.0K | 0.04% | 0.00% | Jun 2026 |
| GS Absolute Ret Trkr I Acc EUR Hdg | 27.9K | 0.04% | 0.00% | Aug 2026 |
| Vanguard Balanced Index Inv | 26.3K | 0.03% | 0.00% | Sep 2026 |
| Vanguard U.S. Eq Idx £ Acc | 16.5K | 0.02% | 0.00% | Sep 2026 |
| Gabelli Global Mini Mites I | 8.00K | 0.01% | 0.00% | Jun 2026 |
Top institutions holding STIM.US
| Holder | Shares | % of shares | Change | As of |
|---|---|---|---|---|
| Madryn Asset Management, LP | 18.5M | 23.85% | +0.35% | Jun 2026 |
| UBS Group AG | 2.28M | 2.93% | -20.61% | Jun 2026 |
| Wexford Capital LP | 2.00M | 2.58% | +185.70% | Jun 2026 |
| FourWorld Capital Management LLC | 1.74M | 2.24% | +17.11% | Jun 2026 |
| Lane Generational LLC | 1.63M | 2.10% | -7.96% | Jun 2026 |
| Vanguard Capital Management, LLC | 1.51M | 1.94% | -26.41% | Jun 2026 |
| Masters Capital Management LLC | 1.00M | 1.29% | 0.00% | Jun 2026 |
| AdvisorShares Investments, LLC | 743K | 0.96% | +20.35% | Jun 2026 |
| Ikarian Capital, LLC | 701K | 0.90% | 0.00% | Jun 2026 |
| BlackRock Inc | 597K | 0.77% | -74.27% | Jun 2026 |
| HighTower Advisors, LLC | 564K | 0.73% | +0.24% | Jun 2026 |
| Marshall Wace Asset Management Ltd | 486K | 0.62% | 0.00% | Jun 2026 |
| Geode Capital Management, LLC | 458K | 0.59% | -52.19% | Jun 2026 |
| Renaissance Technologies Corp | 424K | 0.55% | 0.00% | Sep 2026 |
| Citadel Advisors Llc | 422K | 0.54% | +450.81% | Jun 2026 |
| Dauntless Investment Group, LLC | 369K | 0.48% | +37.14% | Jun 2026 |
| State Street Corp | 290K | 0.37% | -65.55% | Jun 2026 |
| Centiva Capital LP | 286K | 0.37% | +68.86% | Jun 2026 |
| Vanguard Fiduciary Trust Co | 265K | 0.34% | +2.60% | Jun 2026 |
| The Goldman Sachs Group Inc | 264K | 0.34% | +13.06% | Jun 2026 |
Neuronetics Inc company profile
- Company name
- Neuronetics Inc
- Ticker
- STIM.US
- Exchange
- USA Stocks
- Listed since
- Jun 28, 2018
- Sector
- Healthcare
- Industry
- Health Care Equipment & Supplies
- Employees
- 658
- Fiscal year end
- December
- Address
- 3222 Phoenixville Pike, Malvern, PA, United States, 19355
- Phone
- 877 600 7555
- Website
- neurostar.com/neuronetics
About Neuronetics Inc
Neuronetics, Inc. engages in providing in office treatments for patients with neurohealth disorders in the United States and internationally. The company provides NeuroStar Advanced Therapy System, a non-invasive and non-systemic office-based treatment to treat adult patients with major depressive disorder. Its NeuroStar Advanced Therapy System uses transcranial magnetic stimulation to create a pulsed, MRI-strength magnetic field that induces electrical currents designed to stimulate specific areas of the brain associated with mood. The company sells its products through its sales and customer support team to psychiatrists. Neuronetics, Inc. has a strategic collaboration with ANT Neuro to expand the capabilities of the NeuroStar advanced therapy system with advanced image-guided navigation technology. The company was incorporated in 2001 and is headquartered in Malvern, Pennsylvania.
Neuronetics Inc management
4- Mr. Daniel L. ReuversCEO, President & Director · born 1963
- Mr. Nir Naor C.F.A., CPA, L.L.M., M.B.A.Executive VP, CFO, Corporate Secretary, Principal Financial and Accounting Officer & Treasurer · born 1975
- Mr. Robert GreeneSenior Vice President of Sales
- Mr. Cory S. AndersonExecutive Vice President & General Manager of Greenbrook · born 1977