TYG

Tortoise Energy Infrastructure Corporation
TYG
(3.0)44,33 USD
14.2% ROA
25.77% ROE
5.41x PER
479.978.696,00 USD
26.51% DER
7.23% Yield
772.28% NPM
Tortoise Energy Infrastructure Corporation Stock Analysis
Tortoise Energy Infrastructure Corporation Fundamental Analysis
Fundamental analysis in stock investing is like studying the foundation of a house before buying it. It involves looking at a company's financial health, like its earnings, assets, and debts, to determine if it's a good investment based on its fundamental strength and potential for growth.
| # | Analysis | Rating |
|---|---|---|
| 1 |
ROE
The stock's ROE exceeds expectations (23.97%), revealing strong profitability and efficient use of shareholders' equity, making it an attractive investment opportunity. |
|
| 2 |
ROA
This stock has a great ability to make a lot of money from the things it owns, which makes it a really good investment for smart investors. |
|
| 3 |
PBV
The stock's low PBV ratio (0.76x) suggests it's undervalued, making it an attractive opportunity for investors. |
|
| 4 |
DER
The stock has a low debt to equity ratio (25%), which means it has a small amount of debt compared to the ownership it holds |
|
| 5 |
Dividend
The company's consistent dividend payouts over the past five years exemplify its strong commitment to providing shareholders with reliable returns, making it an attractive investment option. |
|
| 6 |
Graham Number
The Graham number of this company suggests that its stock price may be undervalued, indicating a potentially attractive investment opportunity. |
|
| 7 |
Buffet Intrinsic Value
The company's stock shows potential as it is undervalued (95) according to Warren Buffett's formula, indicating that its intrinsic value exceeds the market price. |
|
| 8 |
Revenue Growth
Company has experienced no growth in revenue over the past three years, suggesting limited profitability and making it a less desirable investment opportunity. |
|
| 9 |
Net Profit Growth
Over the past five years, this company's net profit has failed to exhibit any growth, indicating a stagnant financial performance and making it a less favorable choice for potential investors. |
|
| 10 |
Assets Growth
Company has experienced no growth in revenue over the past three years, suggesting limited profitability and making it a less desirable investment opportunity. |
|
| 11 |
Dividend Growth
The company's dividend growth has shown no improvement in the past three years, making it a less attractive investment option for those seeking increasing returns. |
Tortoise Energy Infrastructure Corporation Technical Analysis
Technical analysis in stock investing is like reading the patterns on a weather map to predict future weather conditions. It involves studying past stock price movements and trading volumes to make predictions about where a stock's price might go next, without necessarily looking at the company's financial health.
| # | Analysis | Recommendation |
|---|---|---|
| 1 | Awesome Oscillator | Hold |
| 2 | MACD | Sell |
| 3 | RSI | Hold |
| 4 | Stoch RSI | Sell |
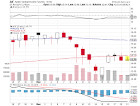
Tortoise Energy Infrastructure Corporation Price Chart
Financial Statements
Financial statements are like report cards for companies. They show how much money a company makes (income statement), what it owns and owes (balance sheet), and where it spends its money (cash flow statement), helping stock investors understand if a company is healthy and worth investing in.
Income Statements
An income statement for a company is like a scoreboard for its profits and losses. It shows how much money the company made (revenue) and how much it spent to make that money (expenses), helping stock investors see if a company is making a profit or not.
Revenue in stock investing is the total amount of money a company earns from its sales, and it's a key factor that investors consider to assess a company's financial performance and growth potential.
| Year | Revenue | Growth |
|---|---|---|
| 2004 | 3.580.000 | |
| 2005 | 7.180.000 | 50.14% |
| 2006 | 7.680.000 | 6.51% |
| 2007 | 9.910.000 | 22.5% |
| 2008 | 14.090.000 | 29.67% |
| 2009 | 13.470.000 | -4.6% |
| 2010 | 6.210.000 | -116.91% |
| 2011 | 1.500.000 | -314% |
| 2012 | 7.955.835 | 81.15% |
| 2013 | 9.424.511 | 15.58% |
| 2014 | 22.471.312 | 58.06% |
| 2015 | 411.442.914 | 94.54% |
| 2016 | 183.745.294 | -123.92% |
| 2017 | -121.629.606 | 251.07% |
| 2018 | 80.236.471 | 251.59% |
| 2019 | -185.133.932 | 143.34% |
| 2020 | 30.285.880 | 711.29% |
| 2020 | -568.079.958 | 105.33% |
| 2021 | 136.366.911 | 516.58% |
| 2022 | 105.618.170 | -29.11% |
| 2023 | 15.759.556 | -570.18% |
| 2024 | -3.807.376 | 513.92% |
Research and Development Expenses are the costs a company incurs to create and improve its products or services, which can be important for investors to evaluate a company's innovation and potential for future growth.
| Year | Research and Development Expenses | Growth |
|---|---|---|
| 2004 | 0 | |
| 2005 | 0 | 0% |
| 2006 | 0 | 0% |
| 2007 | 0 | 0% |
| 2008 | 0 | 0% |
| 2009 | 0 | 0% |
| 2010 | 0 | 0% |
| 2011 | 0 | 0% |
| 2012 | 0 | 0% |
| 2013 | 0 | 0% |
| 2014 | 0 | 0% |
| 2015 | 0 | 0% |
| 2016 | 0 | 0% |
| 2017 | 0 | 0% |
| 2018 | 0 | 0% |
| 2019 | -5 | 100% |
| 2020 | 0 | 0% |
| 2020 | 1 | 0% |
| 2021 | 3 | 100% |
| 2022 | 1 | 0% |
| 2023 | 0 | 0% |
| 2024 | 0 | 0% |
General and Administrative Expenses are the costs a company incurs to run its day-to-day operations, such as office rent, salaries, and utilities, which investors consider to understand a company's overall efficiency and management effectiveness.
| Year | General and Administrative Expenses | Growth |
|---|---|---|
| 2004 | 380.000 | |
| 2005 | 300.000 | -26.67% |
| 2006 | 250.000 | -20% |
| 2007 | 210.000 | -19.05% |
| 2008 | 270.000 | 22.22% |
| 2009 | 460.000 | 41.3% |
| 2010 | 290.000 | -58.62% |
| 2011 | 290.000 | 0% |
| 2012 | 16.882.159 | 98.28% |
| 2013 | 20.165.180 | 16.28% |
| 2014 | 32.313.482 | 37.6% |
| 2015 | 36.652.996 | 11.84% |
| 2016 | 24.936.585 | -46.98% |
| 2017 | 1.751.000 | -1324.13% |
| 2018 | 1.726.085 | -1.44% |
| 2019 | 1.609.935 | -7.21% |
| 2020 | 698.560 | -130.46% |
| 2020 | 1.296.402 | 46.12% |
| 2021 | 1.133.518 | -14.37% |
| 2022 | 937.059 | -20.97% |
| 2023 | 7.184.296 | 86.96% |
| 2024 | 0 | 0% |
EBITDA stands for Earnings Before Interest, Taxes, Depreciation, and Amortization. It is a measure that helps stock investors analyze a company's profitability by looking at its earnings without considering certain expenses. This helps to get a clearer picture of the company's financial performance and its ability to generate cash flow.
| Year | EBITDA | Growth |
|---|---|---|
| 2004 | 95.270.000 | |
| 2005 | 76.630.000 | -24.32% |
| 2006 | 225.180.000 | 65.97% |
| 2007 | 136.420.000 | -65.06% |
| 2008 | -577.110.000 | 123.64% |
| 2009 | 495.360.000 | 216.5% |
| 2010 | 504.320.000 | 1.78% |
| 2011 | 243.960.000 | -106.72% |
| 2012 | 152.554.559 | -59.92% |
| 2013 | 0 | 0% |
| 2014 | 0 | 0% |
| 2015 | -1.322.238.816 | 100% |
| 2016 | 190.298.268 | 794.82% |
| 2017 | -187.447.587 | 201.52% |
| 2018 | -13.626.228 | -1275.64% |
| 2019 | -238.757.631 | 94.29% |
| 2020 | -5.478.807.760 | 95.64% |
| 2020 | -669.008.719 | -718.94% |
| 2021 | 154.925.723 | 531.83% |
| 2022 | 110.735.711 | -39.91% |
| 2023 | -11.650.731 | 1050.46% |
| 2024 | 292.248.560 | 103.99% |
Gross profit is the money a company makes from selling its products or services after subtracting the cost of producing or providing them, and it is an important measure for investors to understand a company's profitability.
| Year | Gross Profit | Growth |
|---|---|---|
| 2004 | -460.000 | |
| 2005 | -5.010.000 | 90.82% |
| 2006 | -9.020.000 | 44.46% |
| 2007 | -19.330.000 | 53.34% |
| 2008 | -14.290.000 | -35.27% |
| 2009 | -6.600.000 | -116.52% |
| 2010 | -17.530.000 | 62.35% |
| 2011 | -13.900.000 | -26.12% |
| 2012 | -8.694.165 | -59.88% |
| 2013 | -10.405.489 | 16.45% |
| 2014 | -9.368.688 | -11.07% |
| 2015 | 375.404.857 | 102.5% |
| 2016 | 159.234.039 | -135.76% |
| 2017 | -147.186.797 | 208.19% |
| 2018 | 57.652.789 | 355.3% |
| 2019 | -205.701.496 | 128.03% |
| 2020 | 6.345.680 | 3341.6% |
| 2020 | -575.966.859 | 101.1% |
| 2021 | 131.051.353 | 539.5% |
| 2022 | 99.598.259 | -31.58% |
| 2023 | 15.759.556 | -531.99% |
| 2024 | -14.463.692 | 208.96% |
Net income in stock investing is like the money a company actually gets to keep as profit after paying all its bills, and it's an important measure to understand how well a company is doing financially.
| Year | Net Profit | Growth |
|---|---|---|
| 2004 | 47.600.000 | |
| 2005 | 37.830.000 | -25.83% |
| 2006 | 111.310.000 | 66.01% |
| 2007 | 65.820.000 | -69.11% |
| 2008 | -291.260.000 | 122.6% |
| 2009 | 247.000.000 | 217.92% |
| 2010 | 246.680.000 | -0.13% |
| 2011 | 70.310.000 | -250.85% |
| 2012 | 135.790.835 | 48.22% |
| 2013 | 270.776.655 | 49.85% |
| 2014 | 233.602.635 | -15.91% |
| 2015 | -838.964.252 | 127.84% |
| 2016 | 106.284.573 | 889.36% |
| 2017 | -113.427.641 | 193.7% |
| 2018 | 96.354.291 | 217.72% |
| 2019 | -191.409.708 | 150.34% |
| 2020 | -2.291.053.160 | 91.65% |
| 2020 | -575.749.881 | -297.93% |
| 2021 | 113.068.205 | 609.21% |
| 2022 | 103.261.597 | -9.5% |
| 2023 | -15.622.613 | 760.98% |
| 2024 | 282.357.284 | 105.53% |
EPS, or earnings per share, is a measure that shows how much profit a company has earned for each outstanding share of its stock, and it is important for stock investors as it helps understand the profitability of a company and compare it with other companies in the market.
| Year | Earning per Share (EPS) | Growth |
|---|---|---|
| 2004 | 4 | |
| 2005 | 3 | -50% |
| 2006 | 7 | 66.67% |
| 2007 | 4 | -100% |
| 2008 | -12 | 125% |
| 2009 | 10 | 220% |
| 2010 | 9 | -11.11% |
| 2011 | 3 | -350% |
| 2012 | 19 | 89.47% |
| 2013 | 38 | 48.65% |
| 2014 | 19 | -94.74% |
| 2015 | -70 | 127.54% |
| 2016 | 9 | 962.5% |
| 2017 | -9 | 188.89% |
| 2018 | 8 | 212.5% |
| 2019 | -14 | 157.14% |
| 2020 | -172 | 91.81% |
| 2020 | -42 | -307.14% |
| 2021 | 9 | 566.67% |
| 2022 | 9 | -12.5% |
| 2023 | -1 | 900% |
| 2024 | 26 | 103.85% |
Cashflow Statements
Cashflow statements show the movement of money in and out of a company, helping stock investors understand how much money a company makes and spends. By examining cashflow statements, investors can assess if a company is generating enough cash to pay its bills, invest in growth, and provide returns to stockholders.
Free cash flow is the leftover cash that a company generates after covering its operating expenses and capital expenditures, which is important for stock investors as it shows how much money a company has available to invest in growth, pay dividends, or reduce debt.
| Year | Free Cashflow | Growth |
|---|---|---|
| 2004 | -433.900.000 | |
| 2005 | -118.200.000 | -267.09% |
| 2006 | -49.000.000 | -141.22% |
| 2007 | -210.900.000 | 76.77% |
| 2008 | 118.200.000 | 278.43% |
| 2009 | 51.400.000 | -129.96% |
| 2010 | -59.300.000 | 186.68% |
| 2011 | 1.100.000 | 5490.91% |
| 2012 | 25.265.294 | 95.65% |
| 2013 | -27.939.517 | 190.43% |
| 2014 | -113.674.852 | 75.42% |
| 2015 | 36.563.743 | 410.9% |
| 2016 | 39.520.807 | 7.48% |
| 2017 | 144.055.941 | 72.57% |
| 2018 | 55.569.391 | -159.24% |
| 2019 | 166.804.547 | 66.69% |
| 2020 | 538.796.210 | 69.04% |
| 2020 | 517.908.930 | -4.03% |
| 2021 | 23.041.166 | -2147.75% |
| 2022 | 44.175.800 | 47.84% |
| 2023 | 90.677.520 | 51.28% |
| 2024 | 6.903.080 | -1213.58% |
Operating cash flow represents the cash generated or consumed by a company's day-to-day operations, excluding external investing or financing activities, and is crucial for stock investors as it shows how much cash a company is generating from its core business operations.
| Year | Operating Cashflow | Growth |
|---|---|---|
| 2004 | -433.900.000 | |
| 2005 | -118.200.000 | -267.09% |
| 2006 | -49.000.000 | -141.22% |
| 2007 | -210.900.000 | 76.77% |
| 2008 | 118.200.000 | 278.43% |
| 2009 | 51.400.000 | -129.96% |
| 2010 | -59.300.000 | 186.68% |
| 2011 | 1.100.000 | 5490.91% |
| 2012 | 25.265.294 | 95.65% |
| 2013 | -27.939.517 | 190.43% |
| 2014 | -113.674.852 | 75.42% |
| 2015 | 36.563.743 | 410.9% |
| 2016 | 39.520.807 | 7.48% |
| 2017 | 144.055.941 | 72.57% |
| 2018 | 55.569.391 | -159.24% |
| 2019 | 166.804.547 | 66.69% |
| 2020 | 538.796.210 | 69.04% |
| 2020 | 517.908.930 | -4.03% |
| 2021 | 23.041.166 | -2147.75% |
| 2022 | 44.175.800 | 47.84% |
| 2023 | 90.677.520 | 51.28% |
| 2024 | 6.903.080 | -1213.58% |
Capex, short for capital expenditures, refers to the money a company spends on acquiring or upgrading tangible assets like buildings, equipment, or technology, which is important for stock investors as it indicates how much a company is investing in its infrastructure to support future growth and profitability.
| Year | Capital Expenditure | Growth |
|---|---|---|
| 2004 | 0 | |
| 2005 | 0 | 0% |
| 2006 | 0 | 0% |
| 2007 | 0 | 0% |
| 2008 | 0 | 0% |
| 2009 | 0 | 0% |
| 2010 | 0 | 0% |
| 2011 | 0 | 0% |
| 2012 | 0 | 0% |
| 2013 | 0 | 0% |
| 2014 | 0 | 0% |
| 2015 | 0 | 0% |
| 2016 | 0 | 0% |
| 2017 | 0 | 0% |
| 2018 | 0 | 0% |
| 2019 | 0 | 0% |
| 2020 | 0 | 0% |
| 2020 | 0 | 0% |
| 2021 | 0 | 0% |
| 2022 | 0 | 0% |
| 2023 | 0 | 0% |
| 2024 | 0 | 0% |
Balance Sheet
Balance sheets provide a snapshot of a company's financial health and its assets (such as cash, inventory, and property) and liabilities (like debts and obligations) at a specific point in time. For stock investors, balance sheets help assess the company's overall worth and evaluate its ability to meet financial obligations and support future growth.
Equity refers to the ownership interest or stake that shareholders have in a company, representing their claim on its assets and earnings after all debts and liabilities are paid.
| Year | Equity | Growth |
|---|---|---|
| 2004 | 371.600.000 | |
| 2005 | 474.300.000 | 21.65% |
| 2006 | 602.400.000 | 21.26% |
| 2007 | 803.400.000 | 25.02% |
| 2008 | 477.000.000 | -68.43% |
| 2009 | 683.600.000 | 30.22% |
| 2010 | 963.900.000 | 29.08% |
| 2011 | 998.400.000 | 3.46% |
| 2012 | 1.020.421.148 | 2.16% |
| 2013 | 1.245.761.067 | 18.09% |
| 2014 | 2.369.067.581 | 47.42% |
| 2015 | 1.405.733.067 | -68.53% |
| 2016 | 1.412.274.348 | 0.46% |
| 2017 | 1.181.528.470 | -19.53% |
| 2018 | 1.260.299.704 | 6.25% |
| 2019 | 1.552.660.412 | 18.83% |
| 2020 | 438.700.903 | -253.92% |
| 2021 | 549.727.173 | 20.2% |
| 2022 | 594.153.872 | 7.48% |
| 2023 | 487.793.432 | -21.8% |
| 2023 | 380.322.541 | -28.26% |
| 2024 | 435.799.628 | 12.73% |
Assets represent the valuable resources that a company owns, such as cash, inventory, property, and equipment, and understanding a company's assets helps investors assess its value and potential for generating future profits.
| Year | Assets | Growth |
|---|---|---|
| 2004 | 519.000.000 | |
| 2005 | 696.000.000 | 25.43% |
| 2006 | 928.400.000 | 25.03% |
| 2007 | 1.261.600.000 | 26.41% |
| 2008 | 692.200.000 | -82.26% |
| 2009 | 1.000.300.000 | 30.8% |
| 2010 | 1.449.500.000 | 30.99% |
| 2011 | 1.551.900.000 | 6.6% |
| 2012 | 1.729.272.186 | 10.26% |
| 2013 | 2.188.730.085 | 20.99% |
| 2014 | 4.375.596.099 | 49.98% |
| 2015 | 2.795.819.554 | -56.5% |
| 2016 | 2.608.411.873 | -7.18% |
| 2017 | 2.235.314.808 | -16.69% |
| 2018 | 2.136.338.815 | -4.63% |
| 2019 | 1.680.744.738 | -27.11% |
| 2020 | 455.838.761 | -268.71% |
| 2021 | 569.245.418 | 19.92% |
| 2022 | 623.318.660 | 8.68% |
| 2023 | 492.651.105 | -26.52% |
| 2023 | 504.065.997 | 2.26% |
| 2024 | 563.922.274 | 10.61% |
Liabilities refer to the financial obligations or debts that a company owes to creditors or external parties, and understanding a company's liabilities is important for investors as it helps assess the company's financial risk and ability to meet its obligations.
| Year | Liabilities | Growth |
|---|---|---|
| 2004 | 147.400.000 | |
| 2005 | 221.700.000 | 33.51% |
| 2006 | 326.000.000 | 31.99% |
| 2007 | 458.200.000 | 28.85% |
| 2008 | 215.200.000 | -112.92% |
| 2009 | 316.700.000 | 32.05% |
| 2010 | 485.600.000 | 34.78% |
| 2011 | 553.500.000 | 12.27% |
| 2012 | 708.851.038 | 21.92% |
| 2013 | 942.969.018 | 24.83% |
| 2014 | 2.006.528.518 | 53% |
| 2015 | 1.390.086.487 | -44.35% |
| 2016 | 1.196.137.525 | -16.21% |
| 2017 | 1.053.786.338 | -13.51% |
| 2018 | 876.039.111 | -20.29% |
| 2019 | 458.463.653 | -91.08% |
| 2020 | 150.211.251 | -205.21% |
| 2021 | 154.300.747 | 2.65% |
| 2022 | 176.700.682 | 12.68% |
| 2023 | 72.095.979 | -145.09% |
| 2023 | 123.743.456 | 41.74% |
| 2024 | 128.122.646 | 3.42% |
Tortoise Energy Infrastructure Corporation Financial Ratio (TTM)
Valuation Metrics
- Revenue per Share
- 0.98
- Net Income per Share
- 7.44
- Price to Earning Ratio
- 5.41x
- Price To Sales Ratio
- 45.49x
- POCF Ratio
- 5.94
- PFCF Ratio
- 6.58
- Price to Book Ratio
- 0.99
- EV to Sales
- 56.5
- EV Over EBITDA
- 6.86
- EV to Operating CashFlow
- 8.18
- EV to FreeCashFlow
- 8.18
- Earnings Yield
- 0.18
- FreeCashFlow Yield
- 0.15
- Market Cap
- 0,48 Bil.
- Enterprise Value
- 0,60 Bil.
- Graham Number
- 82.31
- Graham NetNet
- -11.25
Income Statement Metrics
- Net Income per Share
- 7.44
- Income Quality
- 0.91
- ROE
- 0.2
- Return On Assets
- 0.19
- Return On Capital Employed
- 0.01
- Net Income per EBT
- 0.98
- EBT Per Ebit
- 16.39
- Ebit per Revenue
- 0.48
- Effective Tax Rate
- 0.02
Margins
- Sales, General, & Administrative to Revenue
- 0.52
- Research & Developement to Revenue
- 0
- Stock Based Compensation to Revenue
- 0
- Gross Profit Margin
- 0.61
- Operating Profit Margin
- 0.48
- Pretax Profit Margin
- 7.91
- Net Profit Margin
- 7.72
Dividends
- Dividend Yield
- 0.07
- Dividend Yield %
- 7.23
- Payout Ratio
- 0.49
- Dividend Per Share
- 2.91
Operating Metrics
- Operating Cashflow per Share
- 6.77
- Free CashFlow per Share
- 6.77
- Capex to Operating CashFlow
- 0
- Capex to Revenue
- 0
- Capex to Depreciation
- 0
- Return on Invested Capital
- 0.12
- Return on Tangible Assets
- 0.14
- Days Sales Outstanding
- 321.31
- Days Payables Outstanding
- 0
- Days of Inventory on Hand
- 0
- Receivables Turnover
- 1.14
- Payables Turnover
- 0
- Inventory Turnover
- 0
- Capex per Share
- 0
Balance Sheet
- Cash per Share
- 0,00
- Book Value per Share
- 40,48
- Tangible Book Value per Share
- 40.48
- Shareholders Equity per Share
- 40.48
- Interest Debt per Share
- 11.2
- Debt to Equity
- 0.27
- Debt to Assets
- 0.2
- Net Debt to EBITDA
- 1.34
- Current Ratio
- 0
- Tangible Asset Value
- 0,44 Bil.
- Net Current Asset Value
- -0,13 Bil.
- Invested Capital
- 0
- Working Capital
- 0,00 Bil.
- Intangibles to Total Assets
- 0
- Average Receivables
- 0,01 Bil.
- Average Payables
- 0,00 Bil.
- Average Inventory
- 0
- Debt to Market Cap
- 0.24
Dividends
Dividends in stock investing are like rewards that companies give to their shareholders. They are a portion of the company's profits distributed to investors, typically in the form of cash payments, as a way for them to share in the company's success.
| Year | Dividends | Growth |
|---|---|---|
| 2004 | 1 | |
| 2005 | 2 | 100% |
| 2006 | 2 | 50% |
| 2007 | 2 | 0% |
| 2008 | 2 | 0% |
| 2009 | 2 | 0% |
| 2010 | 2 | 0% |
| 2011 | 2 | 0% |
| 2012 | 2 | 0% |
| 2013 | 2 | 0% |
| 2014 | 2 | 0% |
| 2015 | 3 | 0% |
| 2016 | 3 | 0% |
| 2017 | 3 | 0% |
| 2018 | 3 | 0% |
| 2019 | 3 | 0% |
| 2020 | 1 | 0% |
| 2021 | 1 | 100% |
| 2022 | 3 | 50% |
| 2023 | 3 | 0% |
| 2024 | 2 | 0% |
Tortoise Energy Infrastructure Corporation Profile
About Tortoise Energy Infrastructure Corporation
Tortoise Energy Infrastructure Corporation is a closed ended equity mutual fund launched and managed by Tortoise Capital Advisors L.L.C. The fund invests in the public equity markets of the United States. It seeks to invest in the stocks of companies operating in the energy infrastructure sector, with an emphasis on those companies that are engaged in transporting, processing, storing, distributing or marketing natural gas, natural gas liquids (primarily propane), coal, crude oil or refined petroleum products, or exploring, developing, managing or producing such commodities. The fund primarily invests in securities of publicly traded Master Limited Partnerships and stocks of companies having a market capitalization greater than $100 million. Tortoise Energy Infrastructure Corporation was formed on October 29, 2003 and is domiciled in the United States.
- CEO
- Mr. Terry Clyde Matlack CFA, J
- Employee
- 0
- Address
-
6363 College Boulevard
Overland Park, 66211-1938
Tortoise Energy Infrastructure Corporation Executives & BODs
| # | Name | Age |
|---|---|---|
| 1 |
Mr. H. Kevin Birzer CFA, CPA, MBA,BBA Chairman and Senior Managing Director of Tortoise Capital Advisors Llc |
70 |
| 2 |
Mr. Brian Alan Kessens C.F.A. Member of Investment Committee |
70 |
| 3 |
Mr. Terry Clyde Matlack CFA, J.D. Chief Executive Officer and Director |
70 |
| 4 |
Mr. Edward P. Russell Senior Managing Director |
70 |
Tortoise Energy Infrastructure Corporation Competitors