WPHO.L
Windar Photonics PLC
WPHO.L
(1.0)43,00 GBp
-16.39% ROA
-226.89% ROE
-71.3x PER
38.321.116,34 GBp
708.07% DER
0% Yield
-27.47% NPM
Windar Photonics PLC Stock Analysis
Windar Photonics PLC Fundamental Analysis
Fundamental analysis in stock investing is like studying the foundation of a house before buying it. It involves looking at a company's financial health, like its earnings, assets, and debts, to determine if it's a good investment based on its fundamental strength and potential for growth.
| # | Analysis | Rating |
|---|---|---|
| 1 |
ROE
The stock's ROE exceeds expectations (516.83%), revealing strong profitability and efficient use of shareholders' equity, making it an attractive investment opportunity. |
|
| 2 |
Revenue Growth
This company's revenue has shown remarkable growth over the past three years, making it an excellent choice for seeking a consistently prosperous investment. |
|
| 3 |
Net Profit Growth
This company's net profit has consistently grown over the past three years, showcasing a positive financial trend and making it an appealing investment opportunity. |
|
| 4 |
ROA
The stock's ROA (-34.78%) indicates that it's not effectively utilizing its assets to generate profits, making it a less favorable option to invest and earn consistent returns. |
|
| 5 |
PBV
The stock's elevated P/BV ratio (89.91x) raises concerns about its overvaluation, making it an imprudent choice for investors seeking value. |
|
| 6 |
DER
The company has a high debt to equity ratio (542%), which means it owes a lot of money compared to what it actually owns, making it financially risky. |
|
| 7 |
Assets Growth
Company's revenue has stayed stagnant, showing no signs of improvement and making it a less favorable choice. |
|
| 8 |
Graham Number
Based on the Graham number, this company's stock price appears to be higher than its intrinsic value, signaling a potentially unfavorable investment choice. |
|
| 9 |
Dividend Growth
Investors should note the company's stagnant dividend growth over the past three years, indicating limited profitability and potentially diminishing returns. |
|
| 10 |
Dividend
The company has not distributed any dividends in the past three years, which may raise concerns for investors looking for regular income from their investments. |
|
| 11 |
Buffet Intrinsic Value
The company's stock presents a potential concern as it appears overvalued (-1) by Warren Buffett's formula, indicating that its market price exceeds its estimated intrinsic value. |
Windar Photonics PLC Technical Analysis
Technical analysis in stock investing is like reading the patterns on a weather map to predict future weather conditions. It involves studying past stock price movements and trading volumes to make predictions about where a stock's price might go next, without necessarily looking at the company's financial health.
| # | Analysis | Recommendation |
|---|---|---|
| 1 | Awesome Oscillator | Hold |
| 2 | MACD | Sell |
| 3 | RSI | Buy |
| 4 | Stoch RSI | Hold |
Windar Photonics PLC Price Chart
Financial Statements
Financial statements are like report cards for companies. They show how much money a company makes (income statement), what it owns and owes (balance sheet), and where it spends its money (cash flow statement), helping stock investors understand if a company is healthy and worth investing in.
Income Statements
An income statement for a company is like a scoreboard for its profits and losses. It shows how much money the company made (revenue) and how much it spent to make that money (expenses), helping stock investors see if a company is making a profit or not.
Revenue in stock investing is the total amount of money a company earns from its sales, and it's a key factor that investors consider to assess a company's financial performance and growth potential.
| Year | Revenue | Growth |
|---|---|---|
| 2011 | 0 | |
| 2012 | 0 | 0% |
| 2013 | 74.080 | 100% |
| 2014 | 1.038.673 | 92.87% |
| 2015 | 945.905 | -9.81% |
| 2016 | 1.196.037 | 20.91% |
| 2017 | 2.213.664 | 45.97% |
| 2018 | 3.499.867 | 36.75% |
| 2019 | 1.177.897 | -197.13% |
| 2019 | 1.177.897 | 0% |
| 2020 | 1.333.956 | 11.7% |
| 2021 | 551.535 | -141.86% |
| 2022 | 1.853.249 | 70.24% |
| 2023 | 5.388.288 | 65.61% |
Research and Development Expenses are the costs a company incurs to create and improve its products or services, which can be important for investors to evaluate a company's innovation and potential for future growth.
| Year | Research and Development Expenses | Growth |
|---|---|---|
| 2011 | 0 | |
| 2012 | 0 | 0% |
| 2013 | 780.819 | 100% |
| 2014 | 693.722 | -12.56% |
| 2015 | 856.480 | 19% |
| 2016 | 624.590 | -37.13% |
| 2017 | 707.044 | 11.66% |
| 2018 | 655.993 | -7.78% |
| 2019 | 0 | 0% |
| 2019 | 755.910 | 100% |
| 2020 | 776.278 | 2.62% |
| 2021 | 582.921 | -33.17% |
| 2022 | 808.243 | 27.88% |
| 2023 | 0 | 0% |
General and Administrative Expenses are the costs a company incurs to run its day-to-day operations, such as office rent, salaries, and utilities, which investors consider to understand a company's overall efficiency and management effectiveness.
| Year | General and Administrative Expenses | Growth |
|---|---|---|
| 2011 | 0 | |
| 2012 | 0 | 0% |
| 2013 | 1.387.984 | 100% |
| 2014 | 1.882.078 | 26.25% |
| 2015 | 3.516.573 | 46.48% |
| 2016 | 3.438.014 | -2.29% |
| 2017 | 2.481.600 | -38.54% |
| 2018 | 2.391.798 | -3.75% |
| 2019 | 3.680.990 | 35.02% |
| 2019 | 3.413.673 | -7.83% |
| 2020 | 1.896.238 | -80.02% |
| 2021 | 1.627.755 | -16.49% |
| 2022 | 1.778.815 | 8.49% |
| 2023 | 4.623.336 | 61.53% |
EBITDA stands for Earnings Before Interest, Taxes, Depreciation, and Amortization. It is a measure that helps stock investors analyze a company's profitability by looking at its earnings without considering certain expenses. This helps to get a clearer picture of the company's financial performance and its ability to generate cash flow.
| Year | EBITDA | Growth |
|---|---|---|
| 2011 | -37.615 | |
| 2012 | -421.485 | 91.08% |
| 2013 | -1.043.936 | 59.63% |
| 2014 | -1.832.996 | 43.05% |
| 2015 | -3.520.048 | 47.93% |
| 2016 | -3.105.908 | -13.33% |
| 2017 | -1.949.364 | -59.33% |
| 2018 | -540.223 | -260.84% |
| 2019 | -2.819.904 | 80.84% |
| 2019 | -3.048.097 | 7.49% |
| 2020 | -1.410.823 | -116.05% |
| 2021 | -1.378.495 | -2.35% |
| 2022 | -971.744 | -41.86% |
| 2023 | -1.199.492 | 18.99% |
Gross profit is the money a company makes from selling its products or services after subtracting the cost of producing or providing them, and it is an important measure for investors to understand a company's profitability.
| Year | Gross Profit | Growth |
|---|---|---|
| 2011 | -10.682 | |
| 2012 | -224.094 | 95.23% |
| 2013 | -417.783 | 46.36% |
| 2014 | 360.523 | 215.88% |
| 2015 | 267.381 | -34.83% |
| 2016 | 568.782 | 52.99% |
| 2017 | 912.617 | 37.68% |
| 2018 | 1.755.296 | 48.01% |
| 2019 | 548.337 | -220.11% |
| 2019 | 548.337 | 0% |
| 2020 | 701.370 | 21.82% |
| 2021 | 446.213 | -57.18% |
| 2022 | 946.611 | 52.86% |
| 2023 | 2.957.952 | 68% |
Net income in stock investing is like the money a company actually gets to keep as profit after paying all its bills, and it's an important measure to understand how well a company is doing financially.
| Year | Net Profit | Growth |
|---|---|---|
| 2011 | -37.615 | |
| 2012 | -372.419 | 89.9% |
| 2013 | -1.332.455 | 72.05% |
| 2014 | -2.613.859 | 49.02% |
| 2015 | -3.785.127 | 30.94% |
| 2016 | -3.145.715 | -20.33% |
| 2017 | -2.225.875 | -41.32% |
| 2018 | -792.972 | -180.7% |
| 2019 | -3.078.909 | 74.25% |
| 2019 | -3.078.909 | 0% |
| 2020 | -1.340.168 | -129.74% |
| 2021 | -1.129.177 | -18.69% |
| 2022 | -1.075.671 | -4.97% |
| 2023 | -1.480.284 | 27.33% |
EPS, or earnings per share, is a measure that shows how much profit a company has earned for each outstanding share of its stock, and it is important for stock investors as it helps understand the profitability of a company and compare it with other companies in the market.
| Year | Earning per Share (EPS) | Growth |
|---|---|---|
| 2011 | 0 | |
| 2012 | 0 | 0% |
| 2013 | 0 | 0% |
| 2014 | 0 | 0% |
| 2015 | 0 | 0% |
| 2016 | 0 | 0% |
| 2017 | 0 | 0% |
| 2018 | 0 | 0% |
| 2019 | 0 | 0% |
| 2019 | 0 | 0% |
| 2020 | 0 | 0% |
| 2021 | 0 | 0% |
| 2022 | 0 | 0% |
| 2023 | 0 | 0% |
Cashflow Statements
Cashflow statements show the movement of money in and out of a company, helping stock investors understand how much money a company makes and spends. By examining cashflow statements, investors can assess if a company is generating enough cash to pay its bills, invest in growth, and provide returns to stockholders.
Free cash flow is the leftover cash that a company generates after covering its operating expenses and capital expenditures, which is important for stock investors as it shows how much money a company has available to invest in growth, pay dividends, or reduce debt.
| Year | Free Cashflow | Growth |
|---|---|---|
| 2011 | -426.275 | |
| 2012 | -959.319 | 55.56% |
| 2013 | -1.117.996 | 14.19% |
| 2014 | -2.123.759 | 47.36% |
| 2015 | -5.016.668 | 57.67% |
| 2016 | -1.576.343 | -218.25% |
| 2017 | -457.977 | -244.2% |
| 2018 | -929.348 | 50.72% |
| 2019 | -1.751.327 | 46.93% |
| 2019 | -569.901 | -207.3% |
| 2020 | -1.040.227 | 45.21% |
| 2021 | -1.046.365 | 0.59% |
| 2022 | -470.991 | -122.16% |
| 2023 | 271.362 | 273.57% |
Operating cash flow represents the cash generated or consumed by a company's day-to-day operations, excluding external investing or financing activities, and is crucial for stock investors as it shows how much cash a company is generating from its core business operations.
| Year | Operating Cashflow | Growth |
|---|---|---|
| 2011 | -284.228 | |
| 2012 | -375.109 | 24.23% |
| 2013 | -1.000.086 | 62.49% |
| 2014 | -2.101.372 | 52.41% |
| 2015 | -4.841.489 | 56.6% |
| 2016 | -1.540.708 | -214.24% |
| 2017 | -413.665 | -272.45% |
| 2018 | -861.223 | 51.97% |
| 2019 | -1.747.900 | 50.73% |
| 2019 | -436.975 | -300% |
| 2020 | -1.035.778 | 57.81% |
| 2021 | -394.101 | -162.82% |
| 2022 | -363.535 | -8.41% |
| 2023 | 428.617 | 184.82% |
Capex, short for capital expenditures, refers to the money a company spends on acquiring or upgrading tangible assets like buildings, equipment, or technology, which is important for stock investors as it indicates how much a company is investing in its infrastructure to support future growth and profitability.
| Year | Capital Expenditure | Growth |
|---|---|---|
| 2011 | 142.048 | |
| 2012 | 584.210 | 75.69% |
| 2013 | 117.909 | -395.48% |
| 2014 | 22.387 | -426.69% |
| 2015 | 175.179 | 87.22% |
| 2016 | 35.635 | -391.59% |
| 2017 | 44.312 | 19.58% |
| 2018 | 68.125 | 34.95% |
| 2019 | 3.427 | -1887.89% |
| 2019 | 132.926 | 97.42% |
| 2020 | 4.449 | -2887.77% |
| 2021 | 652.264 | 99.32% |
| 2022 | 107.456 | -507.01% |
| 2023 | 157.255 | 31.67% |
Balance Sheet
Balance sheets provide a snapshot of a company's financial health and its assets (such as cash, inventory, and property) and liabilities (like debts and obligations) at a specific point in time. For stock investors, balance sheets help assess the company's overall worth and evaluate its ability to meet financial obligations and support future growth.
Equity refers to the ownership interest or stake that shareholders have in a company, representing their claim on its assets and earnings after all debts and liabilities are paid.
| Year | Equity | Growth |
|---|---|---|
| 2011 | 1.345.047 | |
| 2012 | 1.502.287 | 10.47% |
| 2013 | 170.058 | -783.4% |
| 2014 | 6.099.818 | 97.21% |
| 2015 | 2.680.536 | -127.56% |
| 2016 | 1.825.020 | -46.88% |
| 2017 | 1.181.664 | -54.44% |
| 2018 | 2.720.687 | 56.57% |
| 2019 | 854.248 | -218.49% |
| 2020 | 441.377 | -93.54% |
| 2021 | -757.375 | 158.28% |
| 2022 | 341.118 | 322.03% |
| 2023 | 264.923 | -28.76% |
Assets represent the valuable resources that a company owns, such as cash, inventory, property, and equipment, and understanding a company's assets helps investors assess its value and potential for generating future profits.
| Year | Assets | Growth |
|---|---|---|
| 2011 | 1.376.067 | |
| 2012 | 2.359.842 | 41.69% |
| 2013 | 1.925.048 | -22.59% |
| 2014 | 7.850.415 | 75.48% |
| 2015 | 3.995.038 | -96.5% |
| 2016 | 4.062.458 | 1.66% |
| 2017 | 3.781.372 | -7.43% |
| 2018 | 5.115.275 | 26.08% |
| 2019 | 3.515.268 | -45.52% |
| 2020 | 3.437.982 | -2.25% |
| 2021 | 3.408.832 | -0.86% |
| 2022 | 4.290.218 | 20.54% |
| 2023 | 3.601.517 | -19.12% |
Liabilities refer to the financial obligations or debts that a company owes to creditors or external parties, and understanding a company's liabilities is important for investors as it helps assess the company's financial risk and ability to meet its obligations.
| Year | Liabilities | Growth |
|---|---|---|
| 2011 | 31.019 | |
| 2012 | 857.555 | 96.38% |
| 2013 | 1.754.989 | 51.14% |
| 2014 | 1.750.597 | -0.25% |
| 2015 | 1.314.502 | -33.18% |
| 2016 | 2.237.438 | 41.25% |
| 2017 | 2.599.708 | 13.94% |
| 2018 | 2.394.588 | -8.57% |
| 2019 | 2.661.020 | 10.01% |
| 2020 | 2.996.605 | 11.2% |
| 2021 | 4.166.207 | 28.07% |
| 2022 | 3.949.100 | -5.5% |
| 2023 | 3.336.594 | -18.36% |
Windar Photonics PLC Financial Ratio (TTM)
Valuation Metrics
- Revenue per Share
- 0.02
- Net Income per Share
- -0.01
- Price to Earning Ratio
- -71.3x
- Price To Sales Ratio
- 28.45x
- POCF Ratio
- -69.4
- PFCF Ratio
- -60.35
- Price to Book Ratio
- 99.6
- EV to Sales
- 29.73
- EV Over EBITDA
- -133.54
- EV to Operating CashFlow
- -105.33
- EV to FreeCashFlow
- -63.06
- Earnings Yield
- -0.01
- FreeCashFlow Yield
- -0.02
- Market Cap
- 0,04 Bil.
- Enterprise Value
- 0,04 Bil.
- Graham Number
- 0.03
- Graham NetNet
- -0.04
Income Statement Metrics
- Net Income per Share
- -0.01
- Income Quality
- 2.08
- ROE
- -2.27
- Return On Assets
- -0.1
- Return On Capital Employed
- -0.23
- Net Income per EBT
- 0.76
- EBT Per Ebit
- 1.22
- Ebit per Revenue
- -0.3
- Effective Tax Rate
- -0.24
Margins
- Sales, General, & Administrative to Revenue
- 0.86
- Research & Developement to Revenue
- 0
- Stock Based Compensation to Revenue
- 0.07
- Gross Profit Margin
- 0.55
- Operating Profit Margin
- -0.3
- Pretax Profit Margin
- -0.36
- Net Profit Margin
- -0.27
Dividends
- Dividend Yield
- 0
- Dividend Yield %
- 0
- Payout Ratio
- 0
- Dividend Per Share
- 0
Operating Metrics
- Operating Cashflow per Share
- -0.01
- Free CashFlow per Share
- -0.01
- Capex to Operating CashFlow
- -0.67
- Capex to Revenue
- 0.19
- Capex to Depreciation
- 4.33
- Return on Invested Capital
- -0.23
- Return on Tangible Assets
- -0.16
- Days Sales Outstanding
- 148.02
- Days Payables Outstanding
- 343.76
- Days of Inventory on Hand
- 431.92
- Receivables Turnover
- 2.47
- Payables Turnover
- 1.06
- Inventory Turnover
- 0.85
- Capex per Share
- 0
Balance Sheet
- Cash per Share
- 0,00
- Book Value per Share
- 0,00
- Tangible Book Value per Share
- -0.02
- Shareholders Equity per Share
- 0
- Interest Debt per Share
- 0.03
- Debt to Equity
- 7.08
- Debt to Assets
- 0.52
- Net Debt to EBITDA
- -5.75
- Current Ratio
- 0.99
- Tangible Asset Value
- 0,00 Bil.
- Net Current Asset Value
- 0,00 Bil.
- Invested Capital
- 1710100
- Working Capital
- 0,00 Bil.
- Intangibles to Total Assets
- 0.37
- Average Receivables
- 0,00 Bil.
- Average Payables
- 0,00 Bil.
- Average Inventory
- 802367
- Debt to Market Cap
- 0.05
Dividends
Dividends in stock investing are like rewards that companies give to their shareholders. They are a portion of the company's profits distributed to investors, typically in the form of cash payments, as a way for them to share in the company's success.
| Year | Dividends | Growth |
|---|
Windar Photonics PLC Profile
About Windar Photonics PLC
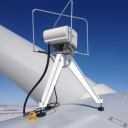
Windar Photonics PLC, through its subsidiaries, develops and sells light detection and ranging sensors, and associated products for use on electricity generating wind turbines in Europe, China, and rest of Asia. It offers WindEYE and WindVISION sensors, which measure wind speed by scanning a laser beam ahead of the wind turbines. The company also provides WindTIMIZER that works as a mediator between the WindEYE and the wind turbine controller; and retrofit control system. The company was incorporated in 2014 and is based in London, the United Kingdom.
- CEO
- Mr. Jorgen Korsgaard Jensen
- Employee
- 29
- Address
-
3 More London Riverside
London, SE1 2AQ
Windar Photonics PLC Executives & BODs
| # | Name | Age |
|---|---|---|
| 1 |
Mr. Jorgen Korsgaard Jensen Founder, Chief Executive Officer, Executive Director & Chief Technology Officer |
70 |
| 2 |
Edward Indran Ratnam FCA Company Secretary |
70 |