INFU
InfuSystem Holdings, Inc.
INFU
(2.0)8,42 USD
0.37% ROA
2.78% ROE
407.36x PER
149.207.800,00 USD
63.88% DER
0% Yield
1.12% NPM
InfuSystem Holdings, Inc. Stock Analysis
InfuSystem Holdings, Inc. Fundamental Analysis
Fundamental analysis in stock investing is like studying the foundation of a house before buying it. It involves looking at a company's financial health, like its earnings, assets, and debts, to determine if it's a good investment based on its fundamental strength and potential for growth.
| # | Analysis | Rating |
|---|---|---|
| 1 |
Revenue Growth
This company's revenue has experienced steady growth over the last five years, indicating a reliable and prosperous financial trajectory. |
|
| 2 |
Assets Growth
With a track record of consistent revenue growth in the past five years, this company presents a compelling opportunity. |
|
| 3 |
ROE
The stock's ROE falls within an average range (1.36%), demonstrating satisfactory profitability and efficiency in utilizing shareholders' equity. |
|
| 4 |
ROA
The stock's ROA (0.73%) indicates that it's doing well in making money from the things it owns. This makes it a good option to invest and make consistent profits. |
|
| 5 |
DER
The stock has a reasonable amount of debt compared to its ownership (80%), suggesting a balanced financial position and a moderate level of risk. |
|
| 6 |
Buffet Intrinsic Value
Based on Warren Buffett's formula, the company's stock appears undervalued (140.826), presenting an attractive investment chance with its intrinsic value surpassing the current market price. |
|
| 7 |
PBV
The stock's elevated P/BV ratio (3.9x) raises concerns about its overvaluation, making it an imprudent choice for investors seeking value. |
|
| 8 |
Net Profit Growth
The net profit of this company has shown no signs of growth over the last five years, suggesting limited profitability and making it a less attractive investment opportunity. |
|
| 9 |
Graham Number
Based on the Graham number, this company's stock price appears to be higher than its intrinsic value, signaling a potentially unfavorable investment choice. |
|
| 10 |
Dividend Growth
The company's dividend growth has been flat for the past three years, raising concerns for potential investors seeking reliable returns. |
|
| 11 |
Dividend
The company has not distributed any dividends in the past three years, which may raise concerns for investors looking for regular income from their investments. |
InfuSystem Holdings, Inc. Technical Analysis
Technical analysis in stock investing is like reading the patterns on a weather map to predict future weather conditions. It involves studying past stock price movements and trading volumes to make predictions about where a stock's price might go next, without necessarily looking at the company's financial health.
| # | Analysis | Recommendation |
|---|---|---|
| 1 | Awesome Oscillator | Buy |
| 2 | MACD | Buy |
| 3 | RSI | Hold |
| 4 | Stoch RSI | Sell |
InfuSystem Holdings, Inc. Price Chart
Financial Statements
Financial statements are like report cards for companies. They show how much money a company makes (income statement), what it owns and owes (balance sheet), and where it spends its money (cash flow statement), helping stock investors understand if a company is healthy and worth investing in.
Income Statements
An income statement for a company is like a scoreboard for its profits and losses. It shows how much money the company made (revenue) and how much it spent to make that money (expenses), helping stock investors see if a company is making a profit or not.
Revenue in stock investing is the total amount of money a company earns from its sales, and it's a key factor that investors consider to assess a company's financial performance and growth potential.
| Year | Revenue | Growth |
|---|---|---|
| 2005 | 0 | |
| 2006 | 0 | 0% |
| 2007 | 6.582.000 | 100% |
| 2008 | 35.415.000 | 81.41% |
| 2009 | 38.964.000 | 9.11% |
| 2010 | 47.229.000 | 17.5% |
| 2011 | 54.637.000 | 13.56% |
| 2012 | 58.828.000 | 7.12% |
| 2013 | 62.280.000 | 5.54% |
| 2014 | 66.487.000 | 6.33% |
| 2015 | 72.125.000 | 7.82% |
| 2016 | 70.497.000 | -2.31% |
| 2017 | 71.077.000 | 0.82% |
| 2018 | 67.138.000 | -5.87% |
| 2019 | 81.115.000 | 17.23% |
| 2020 | 97.388.000 | 16.71% |
| 2021 | 102.382.000 | 4.88% |
| 2022 | 109.914.000 | 6.85% |
| 2023 | 127.636.000 | 13.88% |
| 2023 | 125.785.000 | -1.47% |
| 2024 | 134.792.000 | 6.68% |
Research and Development Expenses are the costs a company incurs to create and improve its products or services, which can be important for investors to evaluate a company's innovation and potential for future growth.
| Year | Research and Development Expenses | Growth |
|---|---|---|
| 2005 | 0 | |
| 2006 | 0 | 0% |
| 2007 | 0 | 0% |
| 2008 | 0 | 0% |
| 2009 | 0 | 0% |
| 2010 | 0 | 0% |
| 2011 | 0 | 0% |
| 2012 | 0 | 0% |
| 2013 | 0 | 0% |
| 2014 | 0 | 0% |
| 2015 | 0 | 0% |
| 2016 | 0 | 0% |
| 2017 | 0 | 0% |
| 2018 | 0 | 0% |
| 2019 | 0 | 0% |
| 2020 | 0 | 0% |
| 2021 | 0 | 0% |
| 2022 | 0 | 0% |
| 2023 | 0 | 0% |
| 2023 | 0 | 0% |
| 2024 | 0 | 0% |
General and Administrative Expenses are the costs a company incurs to run its day-to-day operations, such as office rent, salaries, and utilities, which investors consider to understand a company's overall efficiency and management effectiveness.
| Year | General and Administrative Expenses | Growth |
|---|---|---|
| 2005 | 0 | |
| 2006 | 919.218.000.000 | 100% |
| 2007 | 4.891.000 | -18793970.74% |
| 2008 | 11.765.000 | 58.43% |
| 2009 | 12.218.000 | 3.71% |
| 2010 | 20.622.000 | 40.75% |
| 2011 | 17.987.000 | -14.65% |
| 2012 | 23.062.000 | 22.01% |
| 2013 | 18.973.000 | -21.55% |
| 2014 | 19.988.000 | 5.08% |
| 2015 | 23.778.000 | 15.94% |
| 2016 | 24.629.000 | 3.46% |
| 2017 | 25.200.000 | 2.27% |
| 2018 | 24.847.000 | -1.42% |
| 2019 | 29.023.000 | 14.39% |
| 2020 | 35.195.000 | 17.54% |
| 2021 | 42.261.000 | 16.72% |
| 2022 | 46.077.000 | 8.28% |
| 2023 | 46.968.000 | 1.9% |
| 2023 | 45.377.000 | -3.51% |
| 2024 | 46.096.000 | 1.56% |
EBITDA stands for Earnings Before Interest, Taxes, Depreciation, and Amortization. It is a measure that helps stock investors analyze a company's profitability by looking at its earnings without considering certain expenses. This helps to get a clearer picture of the company's financial performance and its ability to generate cash flow.
| Year | EBITDA | Growth |
|---|---|---|
| 2005 | -24.483 | |
| 2006 | -6.820.165 | 99.64% |
| 2007 | -635.000 | -974.04% |
| 2008 | 20.399.000 | 103.11% |
| 2009 | 11.694.000 | -74.44% |
| 2010 | 7.745.000 | -50.99% |
| 2011 | -57.336.000 | 113.51% |
| 2012 | 9.454.000 | 706.47% |
| 2013 | 14.230.000 | 33.56% |
| 2014 | 15.486.000 | 8.11% |
| 2015 | 13.937.000 | -11.11% |
| 2016 | 11.724.000 | -18.88% |
| 2017 | 8.598.000 | -36.36% |
| 2018 | 11.686.000 | 26.42% |
| 2019 | 15.770.000 | 25.9% |
| 2020 | 22.823.000 | 30.9% |
| 2021 | 17.153.000 | -33.06% |
| 2022 | 15.090.000 | -13.67% |
| 2023 | 19.004.000 | 20.6% |
| 2023 | 16.495.999 | -15.2% |
| 2024 | 19.552.000 | 15.63% |
Gross profit is the money a company makes from selling its products or services after subtracting the cost of producing or providing them, and it is an important measure for investors to understand a company's profitability.
| Year | Gross Profit | Growth |
|---|---|---|
| 2005 | 0 | |
| 2006 | 0 | 0% |
| 2007 | 4.962.000 | 100% |
| 2008 | 26.224.000 | 81.08% |
| 2009 | 28.637.000 | 8.43% |
| 2010 | 33.545.000 | 14.63% |
| 2011 | 35.355.000 | 5.12% |
| 2012 | 42.911.000 | 17.61% |
| 2013 | 43.679.000 | 1.76% |
| 2014 | 47.354.000 | 7.76% |
| 2015 | 51.184.000 | 7.48% |
| 2016 | 44.740.000 | -14.4% |
| 2017 | 43.361.000 | -3.18% |
| 2018 | 39.018.000 | -11.13% |
| 2019 | 46.882.000 | 16.77% |
| 2020 | 58.759.000 | 20.21% |
| 2021 | 60.197.000 | 2.39% |
| 2022 | 62.571.000 | 3.79% |
| 2023 | 64.984.000 | 3.71% |
| 2023 | 63.109.000 | -2.97% |
| 2024 | 64.484.000 | 2.13% |
Net income in stock investing is like the money a company actually gets to keep as profit after paying all its bills, and it's an important measure to understand how well a company is doing financially.
| Year | Net Profit | Growth |
|---|---|---|
| 2005 | -24.783 | |
| 2006 | -7.859.344 | 99.68% |
| 2007 | -2.796.000 | -181.09% |
| 2008 | 9.959.000 | 128.08% |
| 2009 | 774.000 | -1186.69% |
| 2010 | -1.852.000 | 141.79% |
| 2011 | -45.443.000 | 95.92% |
| 2012 | -1.489.000 | -2951.91% |
| 2013 | 1.669.000 | 189.22% |
| 2014 | 3.357.000 | 50.28% |
| 2015 | 3.743.000 | 10.31% |
| 2016 | -222.000 | 1786.04% |
| 2017 | -20.707.000 | 98.93% |
| 2018 | -1.095.000 | -1791.05% |
| 2019 | 1.361.000 | 180.46% |
| 2020 | 17.332.000 | 92.15% |
| 2021 | 1.420.000 | -1120.56% |
| 2022 | 18.000 | -7788.89% |
| 2023 | 2.756.000 | 99.35% |
| 2023 | 872.000 | -216.06% |
| 2024 | 2.868.000 | 69.6% |
EPS, or earnings per share, is a measure that shows how much profit a company has earned for each outstanding share of its stock, and it is important for stock investors as it helps understand the profitability of a company and compare it with other companies in the market.
| Year | Earning per Share (EPS) | Growth |
|---|---|---|
| 2005 | 0 | |
| 2006 | -1 | 0% |
| 2007 | 0 | 0% |
| 2008 | 1 | 0% |
| 2009 | 0 | 0% |
| 2010 | 0 | 0% |
| 2011 | -2 | 100% |
| 2012 | 0 | 0% |
| 2013 | 0 | 0% |
| 2014 | 0 | 0% |
| 2015 | 0 | 0% |
| 2016 | 0 | 0% |
| 2017 | -1 | 0% |
| 2018 | 0 | 0% |
| 2019 | 0 | 0% |
| 2020 | 1 | 0% |
| 2021 | 0 | 0% |
| 2022 | 0 | 0% |
| 2023 | 0 | 0% |
| 2023 | 0 | 0% |
| 2024 | 0 | 0% |
Cashflow Statements
Cashflow statements show the movement of money in and out of a company, helping stock investors understand how much money a company makes and spends. By examining cashflow statements, investors can assess if a company is generating enough cash to pay its bills, invest in growth, and provide returns to stockholders.
Free cash flow is the leftover cash that a company generates after covering its operating expenses and capital expenditures, which is important for stock investors as it shows how much money a company has available to invest in growth, pay dividends, or reduce debt.
| Year | Free Cashflow | Growth |
|---|---|---|
| 2005 | -76 | |
| 2006 | -912.353 | 99.99% |
| 2007 | 3.824.000 | 123.86% |
| 2008 | 9.164.000 | 58.27% |
| 2009 | 5.096.000 | -79.83% |
| 2010 | 8.368.000 | 39.1% |
| 2011 | 1.619.000 | -416.86% |
| 2012 | -1.090.000 | 248.53% |
| 2013 | 1.501.000 | 172.62% |
| 2014 | -2.450.000 | 161.27% |
| 2015 | -3.191.000 | 23.22% |
| 2016 | -886.000 | -260.16% |
| 2017 | 3.988.000 | 122.22% |
| 2018 | 3.088.000 | -29.15% |
| 2019 | -8.720.000 | 135.41% |
| 2020 | 3.366.000 | 359.06% |
| 2021 | 1.660.000 | -102.77% |
| 2022 | 2.441.000 | 32% |
| 2023 | 2.633.000 | 7.29% |
| 2023 | 9.970.000 | 73.59% |
| 2024 | 1.972.000 | -405.58% |
Operating cash flow represents the cash generated or consumed by a company's day-to-day operations, excluding external investing or financing activities, and is crucial for stock investors as it shows how much cash a company is generating from its core business operations.
| Year | Operating Cashflow | Growth |
|---|---|---|
| 2005 | -76 | |
| 2006 | -912.353 | 99.99% |
| 2007 | 4.377.000 | 120.84% |
| 2008 | 10.897.000 | 59.83% |
| 2009 | 9.708.000 | -12.25% |
| 2010 | 10.812.000 | 10.21% |
| 2011 | 7.172.000 | -50.75% |
| 2012 | 5.452.000 | -31.55% |
| 2013 | 7.463.000 | 26.95% |
| 2014 | 7.255.000 | -2.87% |
| 2015 | 7.054.000 | -2.85% |
| 2016 | 7.909.000 | 10.81% |
| 2017 | 7.583.000 | -4.3% |
| 2018 | 11.391.000 | 33.43% |
| 2019 | 13.875.000 | 17.9% |
| 2020 | 20.280.000 | 31.58% |
| 2021 | 18.316.000 | -10.72% |
| 2022 | 17.517.000 | -4.56% |
| 2023 | 4.264.000 | -310.81% |
| 2023 | 10.994.000 | 61.22% |
| 2024 | 2.309.000 | -376.14% |
Capex, short for capital expenditures, refers to the money a company spends on acquiring or upgrading tangible assets like buildings, equipment, or technology, which is important for stock investors as it indicates how much a company is investing in its infrastructure to support future growth and profitability.
| Year | Capital Expenditure | Growth |
|---|---|---|
| 2005 | 0 | |
| 2006 | 0 | 0% |
| 2007 | 553.000 | 100% |
| 2008 | 1.733.000 | 68.09% |
| 2009 | 4.612.000 | 62.42% |
| 2010 | 2.444.000 | -88.71% |
| 2011 | 5.553.000 | 55.99% |
| 2012 | 6.542.000 | 15.12% |
| 2013 | 5.962.000 | -9.73% |
| 2014 | 9.705.000 | 38.57% |
| 2015 | 10.245.000 | 5.27% |
| 2016 | 8.795.000 | -16.49% |
| 2017 | 3.595.000 | -144.65% |
| 2018 | 8.303.000 | 56.7% |
| 2019 | 22.595.000 | 63.25% |
| 2020 | 16.914.000 | -33.59% |
| 2021 | 16.656.000 | -1.55% |
| 2022 | 15.076.000 | -10.48% |
| 2023 | 1.631.000 | -824.34% |
| 2023 | 1.024.000 | -59.28% |
| 2024 | 337.000 | -203.86% |
Balance Sheet
Balance sheets provide a snapshot of a company's financial health and its assets (such as cash, inventory, and property) and liabilities (like debts and obligations) at a specific point in time. For stock investors, balance sheets help assess the company's overall worth and evaluate its ability to meet financial obligations and support future growth.
Equity refers to the ownership interest or stake that shareholders have in a company, representing their claim on its assets and earnings after all debts and liabilities are paid.
| Year | Equity | Growth |
|---|---|---|
| 2005 | -376 | |
| 2006 | 65.145.780 | 100% |
| 2007 | 68.759.000 | 5.25% |
| 2008 | 80.073.000 | 14.13% |
| 2009 | 81.465.000 | 1.71% |
| 2010 | 85.143.000 | 4.32% |
| 2011 | 40.165.000 | -111.98% |
| 2012 | 40.013.000 | -0.38% |
| 2013 | 42.723.000 | 6.34% |
| 2014 | 46.452.000 | 8.03% |
| 2015 | 51.278.000 | 9.41% |
| 2016 | 50.689.000 | -1.16% |
| 2017 | 30.953.000 | -63.76% |
| 2018 | 20.441.000 | -51.43% |
| 2019 | 22.334.000 | 8.48% |
| 2020 | 40.752.000 | 45.2% |
| 2021 | 48.272.000 | 15.58% |
| 2022 | 48.003.000 | -0.56% |
| 2023 | 51.469.000 | 6.73% |
| 2023 | 52.302.000 | 1.59% |
| 2024 | 53.487.000 | 2.22% |
Assets represent the valuable resources that a company owns, such as cash, inventory, property, and equipment, and understanding a company's assets helps investors assess its value and potential for generating future profits.
| Year | Assets | Growth |
|---|---|---|
| 2005 | 178.678 | |
| 2006 | 100.297.830 | 99.82% |
| 2007 | 116.426.000 | 13.85% |
| 2008 | 116.220.000 | -0.18% |
| 2009 | 114.690.000 | -1.33% |
| 2010 | 130.364.000 | 12.02% |
| 2011 | 76.263.000 | -70.94% |
| 2012 | 77.523.000 | 1.63% |
| 2013 | 77.373.000 | -0.19% |
| 2014 | 80.213.000 | 3.54% |
| 2015 | 96.449.000 | 16.83% |
| 2016 | 96.344.000 | -0.11% |
| 2017 | 68.881.000 | -39.87% |
| 2018 | 64.073.000 | -7.5% |
| 2019 | 79.224.000 | 19.12% |
| 2020 | 96.991.000 | 18.32% |
| 2021 | 97.586.000 | 0.61% |
| 2022 | 99.388.000 | 1.81% |
| 2023 | 102.071.000 | 2.63% |
| 2023 | 109.885.000 | 7.11% |
| 2024 | 108.527.000 | -1.25% |
Liabilities refer to the financial obligations or debts that a company owes to creditors or external parties, and understanding a company's liabilities is important for investors as it helps assess the company's financial risk and ability to meet its obligations.
| Year | Liabilities | Growth |
|---|---|---|
| 2005 | 179.054 | |
| 2006 | 35.152.050 | 99.49% |
| 2007 | 47.667.000 | 26.25% |
| 2008 | 36.147.000 | -31.87% |
| 2009 | 33.225.000 | -8.79% |
| 2010 | 45.221.000 | 26.53% |
| 2011 | 36.098.000 | -25.27% |
| 2012 | 37.510.000 | 3.76% |
| 2013 | 34.650.000 | -8.25% |
| 2014 | 33.761.000 | -2.63% |
| 2015 | 45.171.000 | 25.26% |
| 2016 | 45.655.000 | 1.06% |
| 2017 | 37.928.000 | -20.37% |
| 2018 | 43.632.000 | 13.07% |
| 2019 | 56.890.000 | 23.3% |
| 2020 | 56.239.000 | -1.16% |
| 2021 | 49.314.000 | -14.04% |
| 2022 | 51.385.000 | 4.03% |
| 2023 | 50.602.000 | -1.55% |
| 2023 | 57.583.000 | 12.12% |
| 2024 | 55.040.000 | -4.62% |
InfuSystem Holdings, Inc. Financial Ratio (TTM)
Valuation Metrics
- Revenue per Share
- 6.07
- Net Income per Share
- 0.02
- Price to Earning Ratio
- 407.36x
- Price To Sales Ratio
- 1.15x
- POCF Ratio
- 13.1
- PFCF Ratio
- 16.92
- Price to Book Ratio
- 2.79
- EV to Sales
- 1.45
- EV Over EBITDA
- 11.7
- EV to Operating CashFlow
- 16.54
- EV to FreeCashFlow
- 21.34
- Earnings Yield
- 0
- FreeCashFlow Yield
- 0.06
- Market Cap
- 0,15 Bil.
- Enterprise Value
- 0,19 Bil.
- Graham Number
- 0.99
- Graham NetNet
- -1.67
Income Statement Metrics
- Net Income per Share
- 0.02
- Income Quality
- 31.09
- ROE
- 0.01
- Return On Assets
- 0.01
- Return On Capital Employed
- 0.06
- Net Income per EBT
- 0.42
- EBT Per Ebit
- 0.64
- Ebit per Revenue
- 0.04
- Effective Tax Rate
- -0.21
Margins
- Sales, General, & Administrative to Revenue
- 0.36
- Research & Developement to Revenue
- 0
- Stock Based Compensation to Revenue
- 0.03
- Gross Profit Margin
- 0.5
- Operating Profit Margin
- 0.04
- Pretax Profit Margin
- 0.03
- Net Profit Margin
- 0.01
Dividends
- Dividend Yield
- 0
- Dividend Yield %
- 0
- Payout Ratio
- 0
- Dividend Per Share
- 0
Operating Metrics
- Operating Cashflow per Share
- 0.53
- Free CashFlow per Share
- 0.41
- Capex to Operating CashFlow
- 0.22
- Capex to Revenue
- 0.02
- Capex to Depreciation
- 0.21
- Return on Invested Capital
- 0.01
- Return on Tangible Assets
- 0
- Days Sales Outstanding
- 60.16
- Days Payables Outstanding
- 55.46
- Days of Inventory on Hand
- 38.16
- Receivables Turnover
- 6.07
- Payables Turnover
- 6.58
- Inventory Turnover
- 9.57
- Capex per Share
- 0.12
Balance Sheet
- Cash per Share
- 0,01
- Book Value per Share
- 2,51
- Tangible Book Value per Share
- 2.01
- Shareholders Equity per Share
- 2.51
- Interest Debt per Share
- 1.7
- Debt to Equity
- 0.64
- Debt to Assets
- 0.31
- Net Debt to EBITDA
- 2.43
- Current Ratio
- 2.07
- Tangible Asset Value
- 0,04 Bil.
- Net Current Asset Value
- -0,02 Bil.
- Invested Capital
- 37712999
- Working Capital
- 0,02 Bil.
- Intangibles to Total Assets
- 0.1
- Average Receivables
- 0,02 Bil.
- Average Payables
- 0,01 Bil.
- Average Inventory
- 6544000
- Debt to Market Cap
- 0.23
Dividends
Dividends in stock investing are like rewards that companies give to their shareholders. They are a portion of the company's profits distributed to investors, typically in the form of cash payments, as a way for them to share in the company's success.
| Year | Dividends | Growth |
|---|
InfuSystem Holdings, Inc. Profile
About InfuSystem Holdings, Inc.
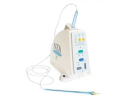
InfuSystem Holdings, Inc., through its subsidiaries, provides infusion pumps, and related products and services in the United States and Canada. The company operates in two segments, Integrated Therapy Services (ITS) and Durable Medical Equipment Services (DME Services). It supplies electronic ambulatory infusion pumps and associated disposable supply kits to oncology, infusion, and hospital outpatient chemotherapy clinics for the treatment of various cancers, including colorectal cancer, pain management, and other disease states. The company also sells, rents, and leases new and pre-owned pole-mounted and ambulatory infusion pumps, and other durable medical equipment; sells treatment-related consumables; and provides biomedical recertification, maintenance, and repair services for oncology practices, as well as other alternate site settings comprising home care and home infusion providers, skilled nursing facilities, pain centers, hospital market, and others. In addition, it offers local and field-based customer support, as well as operates pump service and repair centers. The company was incorporated in 2005 and is headquartered in Rochester Hills, Michigan.
- CEO
- Mr. Richard A. DiIorio
- Employee
- 499
- Address
-
3851 West Hamlin Road
Rochester Hills, 48309
InfuSystem Holdings, Inc. Executives & BODs
| # | Name | Age |
|---|---|---|
| 1 |
Mr. Jerod Funke Executive Vice President & Chief HR Officer |
70 |
| 2 |
Mr. Richard A. DiIorio Chief Executive Officer & Director |
70 |
| 3 |
Ms. Carrie A. Lachance B.S.N., M.B.A., R.N. President, Chief Operating Officer & Director |
70 |
| 4 |
Mr. Barry G. Steele CPA Executive Vice President & Chief Financial Officer |
70 |
| 5 |
Ms. Jeanie Latz Corporate Secretary |
70 |
| 6 |
Mr. Addam Chupa Executive Vice President & Chief Information Officer |
70 |
InfuSystem Holdings, Inc. Competitors