MLSS
Milestone Scientific Inc.
MLSS
(0.5)0,96 USD
-39.03% ROA
-60.26% ROE
-14.88x PER
66.467.422,00 USD
4.28% DER
0% Yield
-52.01% NPM
Milestone Scientific Inc. Stock Analysis
Milestone Scientific Inc. Fundamental Analysis
Fundamental analysis in stock investing is like studying the foundation of a house before buying it. It involves looking at a company's financial health, like its earnings, assets, and debts, to determine if it's a good investment based on its fundamental strength and potential for growth.
| # | Analysis | Rating |
|---|---|---|
| 1 |
DER
The stock has a low debt to equity ratio (6%), which means it has a small amount of debt compared to the ownership it holds |
|
| 2 |
ROE
The stock's ROE indicates a negative return (-75.69%) on shareholders' equity, suggesting poor financial performance. |
|
| 3 |
ROA
The stock's ROA (-67.47%) indicates that it's not effectively utilizing its assets to generate profits, making it a less favorable option to invest and earn consistent returns. |
|
| 4 |
PBV
The stock's high Price-to-Book Value (P/BV) ratio (7.32x) suggests it's overvalued, potentially making it an expensive investment. |
|
| 5 |
Revenue Growth
Company has experienced no growth in revenue over the past three years, suggesting limited profitability and making it a less desirable investment opportunity. |
|
| 6 |
Net Profit Growth
This company's net profit has remained stagnant over the past five years, indicating a lack of growth and making it a less favorable investment option. |
|
| 7 |
Assets Growth
Company's revenue has remained stagnant over the past three years, indicating a lack of growth and making it a less favorable option. |
|
| 8 |
Graham Number
The company's Graham number suggests that its stock price is overestimated, implying that it may not be a promising investment opportunity. |
|
| 9 |
Dividend Growth
The company's dividend growth has remained flat for the past three years, offering no indication of improved returns and making it a less advantageous investment opportunity. |
|
| 10 |
Dividend
The company's lack of dividends in the past three years may concern investors seeking regular income. |
|
| 11 |
Buffet Intrinsic Value
Based on Warren Buffett's formula, the company's stock seems overpriced (-1), indicating a potential drawback for investors as its market price exceeds its estimated intrinsic value. |
Milestone Scientific Inc. Technical Analysis
Technical analysis in stock investing is like reading the patterns on a weather map to predict future weather conditions. It involves studying past stock price movements and trading volumes to make predictions about where a stock's price might go next, without necessarily looking at the company's financial health.
| # | Analysis | Recommendation |
|---|---|---|
| 1 | Awesome Oscillator | Buy |
| 2 | MACD | Buy |
| 3 | RSI | Hold |
| 4 | Stoch RSI | Sell |
Milestone Scientific Inc. Price Chart
Financial Statements
Financial statements are like report cards for companies. They show how much money a company makes (income statement), what it owns and owes (balance sheet), and where it spends its money (cash flow statement), helping stock investors understand if a company is healthy and worth investing in.
Income Statements
An income statement for a company is like a scoreboard for its profits and losses. It shows how much money the company made (revenue) and how much it spent to make that money (expenses), helping stock investors see if a company is making a profit or not.
Revenue in stock investing is the total amount of money a company earns from its sales, and it's a key factor that investors consider to assess a company's financial performance and growth potential.
| Year | Revenue | Growth |
|---|---|---|
| 1996 | 300.000 | |
| 1997 | 2.900.000 | 89.66% |
| 1998 | 8.800.000 | 67.05% |
| 1999 | 2.855.463 | -208.18% |
| 2000 | 5.674.351 | 49.68% |
| 2001 | 4.093.710 | -38.61% |
| 2002 | 4.074.006 | -0.48% |
| 2003 | 3.971.707 | -2.58% |
| 2004 | 4.751.186 | 16.41% |
| 2005 | 6.433.148 | 26.15% |
| 2006 | 5.844.177 | -10.08% |
| 2007 | 6.390.713 | 8.55% |
| 2008 | 6.623.807 | 3.52% |
| 2009 | 8.549.060 | 22.52% |
| 2010 | 9.749.968 | 12.32% |
| 2011 | 8.378.094 | -16.37% |
| 2012 | 8.648.242 | 3.12% |
| 2013 | 10.011.420 | 13.62% |
| 2014 | 10.333.090 | 3.11% |
| 2015 | 9.491.569 | -8.87% |
| 2016 | 10.482.005 | 9.45% |
| 2017 | 11.281.886 | 7.09% |
| 2018 | 9.622.076 | -17.25% |
| 2019 | 8.374.501 | -14.9% |
| 2020 | 5.437.236 | -54.02% |
| 2021 | 10.304.711 | 47.24% |
| 2022 | 8.805.906 | -17.02% |
| 2023 | 8.237.136 | -6.9% |
| 2023 | 9.827.444 | 16.18% |
| 2024 | 7.415.056 | -32.53% |
Research and Development Expenses are the costs a company incurs to create and improve its products or services, which can be important for investors to evaluate a company's innovation and potential for future growth.
| Year | Research and Development Expenses | Growth |
|---|---|---|
| 1996 | 200.000 | |
| 1997 | 1.000.000 | 80% |
| 1998 | 400.000 | -150% |
| 1999 | 455.332 | 12.15% |
| 2000 | 386.250 | -17.89% |
| 2001 | 49.943 | -673.38% |
| 2002 | 147.709 | 66.19% |
| 2003 | 131.015 | -12.74% |
| 2004 | 187.992 | 30.31% |
| 2005 | 286.260 | 34.33% |
| 2006 | 1.005.285 | 71.52% |
| 2007 | 397.354 | -152.99% |
| 2008 | 168.516 | -135.8% |
| 2009 | 241.318 | 30.17% |
| 2010 | 270.494 | 10.79% |
| 2011 | 140.053 | -93.14% |
| 2012 | 181.979 | 23.04% |
| 2013 | 191.345 | 4.89% |
| 2014 | 88.243 | -116.84% |
| 2015 | 100.856 | 12.51% |
| 2016 | 1.270.471 | 92.06% |
| 2017 | 272.746 | -365.81% |
| 2018 | 245.636 | -11.04% |
| 2019 | 189.923 | -29.33% |
| 2020 | 307.850 | 38.31% |
| 2021 | 878.210 | 64.95% |
| 2022 | 1.150.209 | 23.65% |
| 2023 | 681.912 | -68.67% |
| 2023 | 701.378 | 2.78% |
| 2024 | 1.259.872 | 44.33% |
General and Administrative Expenses are the costs a company incurs to run its day-to-day operations, such as office rent, salaries, and utilities, which investors consider to understand a company's overall efficiency and management effectiveness.
| Year | General and Administrative Expenses | Growth |
|---|---|---|
| 1996 | 2.200.000 | |
| 1997 | 7.700.000 | 71.43% |
| 1998 | 9.300.000 | 17.2% |
| 1999 | 7.009.543 | -32.68% |
| 2000 | 8.497.955 | 17.51% |
| 2001 | 5.271.032 | -61.22% |
| 2002 | 3.588.836 | -46.87% |
| 2003 | 3.569.604 | -0.54% |
| 2004 | 5.155.569 | 30.76% |
| 2005 | 6.794.032 | 24.12% |
| 2006 | 5.326.031 | -27.56% |
| 2007 | 6.335.556 | 15.93% |
| 2008 | 5.502.762 | -15.13% |
| 2009 | 6.952.976 | 20.86% |
| 2010 | 6.648.859 | -4.57% |
| 2011 | 6.445.001 | -3.16% |
| 2012 | 5.930.625 | -8.67% |
| 2013 | 5.534.463 | -7.16% |
| 2014 | 7.404.258 | 25.25% |
| 2015 | 9.399.201 | 21.22% |
| 2016 | 11.549.961 | 18.62% |
| 2017 | 11.930.951 | 3.19% |
| 2018 | 10.645.206 | -12.08% |
| 2019 | 0 | 0% |
| 2020 | 0 | 0% |
| 2021 | 0 | 0% |
| 2022 | 0 | 0% |
| 2023 | 0 | 0% |
| 2023 | 0 | 0% |
| 2024 | 0 | 0% |
EBITDA stands for Earnings Before Interest, Taxes, Depreciation, and Amortization. It is a measure that helps stock investors analyze a company's profitability by looking at its earnings without considering certain expenses. This helps to get a clearer picture of the company's financial performance and its ability to generate cash flow.
| Year | EBITDA | Growth |
|---|---|---|
| 1996 | -2.100.000 | |
| 1997 | -7.200.000 | 70.83% |
| 1998 | -10.500.000 | 31.43% |
| 1999 | -5.448.874 | -92.7% |
| 2000 | -6.118.020 | 10.94% |
| 2001 | -2.765.244 | -121.25% |
| 2002 | -1.251.567 | -120.94% |
| 2003 | -1.396.831 | 10.4% |
| 2004 | -2.906.278 | 51.94% |
| 2005 | -3.128.946 | 7.12% |
| 2006 | -3.522.786 | 11.18% |
| 2007 | -3.240.245 | -8.72% |
| 2008 | -1.728.587 | -87.45% |
| 2009 | -2.103.513 | 17.82% |
| 2010 | -572.199 | -267.62% |
| 2011 | -1.239.575 | 53.84% |
| 2012 | -596.202 | -107.91% |
| 2013 | 1.182.827 | 150.4% |
| 2014 | -694.338 | 270.35% |
| 2015 | -2.959.373 | 76.54% |
| 2016 | -6.350.594 | 53.4% |
| 2017 | -4.661.168 | -36.24% |
| 2018 | -5.578.256 | 16.44% |
| 2019 | -3.898.485 | -43.09% |
| 2020 | -7.357.169 | 47.01% |
| 2021 | -7.304.673 | -0.72% |
| 2022 | -8.683.097 | 15.87% |
| 2023 | -5.869.464 | -47.94% |
| 2023 | -6.955.705 | 15.62% |
| 2024 | -6.995.600 | 0.57% |
Gross profit is the money a company makes from selling its products or services after subtracting the cost of producing or providing them, and it is an important measure for investors to understand a company's profitability.
| Year | Gross Profit | Growth |
|---|---|---|
| 1996 | 300.000 | |
| 1997 | 1.300.000 | 76.92% |
| 1998 | -800.000 | 262.5% |
| 1999 | 2.016.001 | 139.68% |
| 2000 | 2.766.185 | 27.12% |
| 2001 | 2.120.554 | -30.45% |
| 2002 | 2.093.057 | -1.31% |
| 2003 | 1.968.568 | -6.32% |
| 2004 | 2.335.360 | 15.71% |
| 2005 | 3.912.126 | 40.3% |
| 2006 | 2.808.531 | -39.29% |
| 2007 | 3.492.665 | 19.59% |
| 2008 | 3.942.691 | 11.41% |
| 2009 | 5.090.781 | 22.55% |
| 2010 | 6.218.516 | 18.14% |
| 2011 | 5.361.452 | -15.99% |
| 2012 | 5.592.251 | 4.13% |
| 2013 | 6.812.512 | 17.91% |
| 2014 | 6.702.325 | -1.64% |
| 2015 | 6.443.309 | -4.02% |
| 2016 | 6.306.472 | -2.17% |
| 2017 | 6.969.379 | 9.51% |
| 2018 | 4.431.301 | -57.28% |
| 2019 | 5.718.359 | 22.51% |
| 2020 | 3.621.312 | -57.91% |
| 2021 | 6.311.900 | 42.63% |
| 2022 | 4.900.814 | -28.79% |
| 2023 | 6.013.736 | 18.51% |
| 2023 | 6.792.612 | 11.47% |
| 2024 | 5.610.900 | -21.06% |
Net income in stock investing is like the money a company actually gets to keep as profit after paying all its bills, and it's an important measure to understand how well a company is doing financially.
| Year | Net Profit | Growth |
|---|---|---|
| 1996 | -1.900.000 | |
| 1997 | -7.400.000 | 74.32% |
| 1998 | -10.700.000 | 30.84% |
| 1999 | -6.972.312 | -53.46% |
| 2000 | -7.509.855 | 7.16% |
| 2001 | -3.991.580 | -88.14% |
| 2002 | -2.440.197 | -63.58% |
| 2003 | -2.412.908 | -1.13% |
| 2004 | -2.996.864 | 19.49% |
| 2005 | -2.754.227 | -8.81% |
| 2006 | -3.152.268 | 12.63% |
| 2007 | -2.938.696 | -7.27% |
| 2008 | -1.187.454 | -147.48% |
| 2009 | -1.530.085 | 22.39% |
| 2010 | -614.508 | -148.99% |
| 2011 | -1.482.100 | 58.54% |
| 2012 | -870.306 | -70.3% |
| 2013 | 1.464.930 | 159.41% |
| 2014 | -1.702.024 | 186.07% |
| 2015 | -5.467.522 | 68.87% |
| 2016 | -5.946.507 | 8.05% |
| 2017 | -5.186.793 | -14.65% |
| 2018 | -7.431.645 | 30.21% |
| 2019 | -7.661.564 | 3% |
| 2020 | -7.486.699 | -2.34% |
| 2021 | -7.119.021 | -5.16% |
| 2022 | -8.706.131 | 18.23% |
| 2023 | -5.865.176 | -48.44% |
| 2023 | -6.929.104 | 15.35% |
| 2024 | 894.552 | 874.59% |
EPS, or earnings per share, is a measure that shows how much profit a company has earned for each outstanding share of its stock, and it is important for stock investors as it helps understand the profitability of a company and compare it with other companies in the market.
| Year | Earning per Share (EPS) | Growth |
|---|---|---|
| 1996 | -1 | |
| 1997 | -4 | 66.67% |
| 1998 | -4 | 0% |
| 1999 | -2 | -50% |
| 2000 | -2 | 0% |
| 2001 | -1 | -100% |
| 2002 | -1 | 0% |
| 2003 | -1 | 0% |
| 2004 | 0 | 0% |
| 2005 | 0 | 0% |
| 2006 | 0 | 0% |
| 2007 | 0 | 0% |
| 2008 | 0 | 0% |
| 2009 | 0 | 0% |
| 2010 | 0 | 0% |
| 2011 | 0 | 0% |
| 2012 | 0 | 0% |
| 2013 | 0 | 0% |
| 2014 | 0 | 0% |
| 2015 | 0 | 0% |
| 2016 | 0 | 0% |
| 2017 | 0 | 0% |
| 2018 | 0 | 0% |
| 2019 | 0 | 0% |
| 2020 | 0 | 0% |
| 2021 | 0 | 0% |
| 2022 | 0 | 0% |
| 2023 | 0 | 0% |
| 2023 | 0 | 0% |
| 2024 | 0 | 0% |
Cashflow Statements
Cashflow statements show the movement of money in and out of a company, helping stock investors understand how much money a company makes and spends. By examining cashflow statements, investors can assess if a company is generating enough cash to pay its bills, invest in growth, and provide returns to stockholders.
Free cash flow is the leftover cash that a company generates after covering its operating expenses and capital expenditures, which is important for stock investors as it shows how much money a company has available to invest in growth, pay dividends, or reduce debt.
| Year | Free Cashflow | Growth |
|---|---|---|
| 1996 | -1.600.000 | |
| 1997 | -5.200.000 | 69.23% |
| 1998 | -12.200.000 | 57.38% |
| 1999 | -5.439.803 | -124.27% |
| 2000 | -2.894.450 | -87.94% |
| 2001 | -1.395.608 | -107.4% |
| 2002 | -750.521 | -85.95% |
| 2003 | -855.859 | 12.31% |
| 2004 | -4.635.398 | 81.54% |
| 2005 | -3.289.409 | -40.92% |
| 2006 | -1.732.563 | -89.86% |
| 2007 | -1.486.314 | -16.57% |
| 2008 | -759.087 | -95.8% |
| 2009 | 228.598 | 432.06% |
| 2010 | -404.070 | 156.57% |
| 2011 | -609.758 | 33.73% |
| 2012 | -81.075 | -652.09% |
| 2013 | 1.232.177 | 106.58% |
| 2014 | 277.981 | -343.26% |
| 2015 | -3.023.858 | 109.19% |
| 2016 | -5.429.540 | 44.31% |
| 2017 | -1.428.609 | -280.06% |
| 2018 | -1.635.507 | 12.65% |
| 2019 | -1.789.204 | 8.59% |
| 2020 | -7.006.366 | 74.46% |
| 2021 | -4.032.770 | -73.74% |
| 2022 | -6.040.523 | 33.24% |
| 2023 | -1.053.200 | -473.54% |
| 2023 | -5.331.010 | 80.24% |
| 2024 | 777.059 | 786.05% |
Operating cash flow represents the cash generated or consumed by a company's day-to-day operations, excluding external investing or financing activities, and is crucial for stock investors as it shows how much cash a company is generating from its core business operations.
| Year | Operating Cashflow | Growth |
|---|---|---|
| 1996 | -1.500.000 | |
| 1997 | -4.700.000 | 68.09% |
| 1998 | -8.600.000 | 45.35% |
| 1999 | -5.332.997 | -61.26% |
| 2000 | -2.842.677 | -87.6% |
| 2001 | -1.384.936 | -105.26% |
| 2002 | -676.177 | -104.82% |
| 2003 | -820.591 | 17.6% |
| 2004 | -4.284.869 | 80.85% |
| 2005 | -3.266.317 | -31.18% |
| 2006 | -1.650.718 | -97.87% |
| 2007 | -1.150.670 | -43.46% |
| 2008 | -442.006 | -160.33% |
| 2009 | 402.951 | 209.69% |
| 2010 | -293.777 | 237.16% |
| 2011 | -570.730 | 48.53% |
| 2012 | -49.718 | -1047.93% |
| 2013 | 1.258.736 | 103.95% |
| 2014 | 376.943 | -233.93% |
| 2015 | -2.946.338 | 112.79% |
| 2016 | -5.398.581 | 45.42% |
| 2017 | -1.229.434 | -339.11% |
| 2018 | -1.628.106 | 24.49% |
| 2019 | -1.779.288 | 8.5% |
| 2020 | -6.984.928 | 74.53% |
| 2021 | -4.017.581 | -73.86% |
| 2022 | -6.031.996 | 33.4% |
| 2023 | -1.053.204 | -472.73% |
| 2023 | -5.326.129 | 80.23% |
| 2024 | 783.655 | 779.65% |
Capex, short for capital expenditures, refers to the money a company spends on acquiring or upgrading tangible assets like buildings, equipment, or technology, which is important for stock investors as it indicates how much a company is investing in its infrastructure to support future growth and profitability.
| Year | Capital Expenditure | Growth |
|---|---|---|
| 1996 | 100.000 | |
| 1997 | 500.000 | 80% |
| 1998 | 3.600.000 | 86.11% |
| 1999 | 106.806 | -3270.6% |
| 2000 | 51.773 | -106.3% |
| 2001 | 10.672 | -385.13% |
| 2002 | 74.344 | 85.65% |
| 2003 | 35.268 | -110.8% |
| 2004 | 350.529 | 89.94% |
| 2005 | 23.092 | -1417.97% |
| 2006 | 81.845 | 71.79% |
| 2007 | 335.644 | 75.62% |
| 2008 | 317.081 | -5.85% |
| 2009 | 174.353 | -81.86% |
| 2010 | 110.293 | -58.08% |
| 2011 | 39.028 | -182.6% |
| 2012 | 31.357 | -24.46% |
| 2013 | 26.559 | -18.07% |
| 2014 | 98.962 | 73.16% |
| 2015 | 77.520 | -27.66% |
| 2016 | 30.959 | -150.4% |
| 2017 | 199.175 | 84.46% |
| 2018 | 7.401 | -2591.19% |
| 2019 | 9.916 | 25.36% |
| 2020 | 21.438 | 53.75% |
| 2021 | 15.189 | -41.14% |
| 2022 | 8.527 | -78.13% |
| 2023 | -4 | 213275% |
| 2023 | 4.881 | 100.08% |
| 2024 | 6.596 | 26% |
Balance Sheet
Balance sheets provide a snapshot of a company's financial health and its assets (such as cash, inventory, and property) and liabilities (like debts and obligations) at a specific point in time. For stock investors, balance sheets help assess the company's overall worth and evaluate its ability to meet financial obligations and support future growth.
Equity refers to the ownership interest or stake that shareholders have in a company, representing their claim on its assets and earnings after all debts and liabilities are paid.
| Year | Equity | Growth |
|---|---|---|
| 1996 | 4.000.000 | |
| 1997 | 18.500.000 | 78.38% |
| 1998 | 8.300.000 | -122.89% |
| 1999 | 2.129.589 | -289.75% |
| 2000 | -1.702.335 | 225.1% |
| 2001 | -4.458.967 | 61.82% |
| 2002 | -6.105.943 | 26.97% |
| 2003 | -2.444.671 | -149.77% |
| 2004 | 4.520.707 | 154.08% |
| 2005 | 6.318.206 | 28.45% |
| 2006 | 3.713.425 | -70.14% |
| 2007 | 1.538.318 | -141.4% |
| 2008 | 1.400.180 | -9.87% |
| 2009 | 2.641.121 | 46.99% |
| 2010 | 2.332.117 | -13.25% |
| 2011 | 1.936.317 | -20.44% |
| 2012 | 1.936.539 | 0.01% |
| 2013 | 5.519.845 | 64.92% |
| 2014 | 15.042.352 | 63.3% |
| 2015 | 9.165.492 | -64.12% |
| 2016 | 8.536.329 | -7.37% |
| 2017 | 7.500.628 | -13.81% |
| 2018 | 1.528.208 | -390.81% |
| 2019 | 1.628.647 | 6.17% |
| 2020 | 16.106.968 | 89.89% |
| 2021 | 16.215.382 | 0.67% |
| 2022 | 10.006.434 | -62.05% |
| 2023 | 6.993.025 | -43.09% |
| 2023 | 8.226.511 | 14.99% |
| 2024 | 8.167.877 | -0.72% |
Assets represent the valuable resources that a company owns, such as cash, inventory, property, and equipment, and understanding a company's assets helps investors assess its value and potential for generating future profits.
| Year | Assets | Growth |
|---|---|---|
| 1996 | 4.700.000 | |
| 1997 | 20.000.000 | 76.5% |
| 1998 | 9.200.000 | -117.39% |
| 1999 | 5.622.162 | -63.64% |
| 2000 | 2.553.817 | -120.15% |
| 2001 | 1.515.739 | -68.49% |
| 2002 | 1.240.713 | -22.17% |
| 2003 | 1.716.490 | 27.72% |
| 2004 | 5.369.331 | 68.03% |
| 2005 | 7.049.600 | 23.83% |
| 2006 | 5.141.608 | -37.11% |
| 2007 | 4.989.565 | -3.05% |
| 2008 | 4.410.750 | -13.12% |
| 2009 | 4.849.994 | 9.06% |
| 2010 | 6.609.023 | 26.62% |
| 2011 | 6.992.202 | 5.48% |
| 2012 | 5.661.103 | -23.51% |
| 2013 | 8.055.346 | 29.72% |
| 2014 | 17.477.428 | 53.91% |
| 2015 | 12.809.327 | -36.44% |
| 2016 | 13.550.650 | 5.47% |
| 2017 | 15.628.787 | 13.3% |
| 2018 | 6.400.968 | -144.16% |
| 2019 | 6.556.289 | 2.37% |
| 2020 | 19.571.450 | 66.5% |
| 2021 | 19.809.744 | 1.2% |
| 2022 | 13.702.086 | -44.57% |
| 2023 | 10.583.558 | -29.47% |
| 2023 | 11.371.512 | 6.93% |
| 2024 | 12.005.240 | 5.28% |
Liabilities refer to the financial obligations or debts that a company owes to creditors or external parties, and understanding a company's liabilities is important for investors as it helps assess the company's financial risk and ability to meet its obligations.
| Year | Liabilities | Growth |
|---|---|---|
| 1996 | 700.000 | |
| 1997 | 1.500.000 | 53.33% |
| 1998 | 900.000 | -66.67% |
| 1999 | 3.492.573 | 74.23% |
| 2000 | 4.256.152 | 17.94% |
| 2001 | 5.974.706 | 28.76% |
| 2002 | 7.346.656 | 18.67% |
| 2003 | 4.161.161 | -76.55% |
| 2004 | 848.624 | -390.34% |
| 2005 | 731.394 | -16.03% |
| 2006 | 1.428.183 | 48.79% |
| 2007 | 3.451.247 | 58.62% |
| 2008 | 3.010.570 | -14.64% |
| 2009 | 2.208.873 | -36.29% |
| 2010 | 4.276.906 | 48.35% |
| 2011 | 5.055.885 | 15.41% |
| 2012 | 3.724.564 | -35.74% |
| 2013 | 2.535.501 | -46.9% |
| 2014 | 2.435.076 | -4.12% |
| 2015 | 3.643.835 | 33.17% |
| 2016 | 5.014.321 | 27.33% |
| 2017 | 8.128.159 | 38.31% |
| 2018 | 4.872.760 | -66.81% |
| 2019 | 4.927.642 | 1.11% |
| 2020 | 3.464.482 | -42.23% |
| 2021 | 3.594.362 | 3.61% |
| 2022 | 3.695.652 | 2.74% |
| 2023 | 3.590.533 | -2.93% |
| 2023 | 3.359.000 | -6.89% |
| 2024 | 4.051.363 | 17.09% |
Milestone Scientific Inc. Financial Ratio (TTM)
Valuation Metrics
- Revenue per Share
- 0.11
- Net Income per Share
- -0.06
- Price to Earning Ratio
- -14.88x
- Price To Sales Ratio
- 7.89x
- POCF Ratio
- -25.16
- PFCF Ratio
- -24.22
- Price to Book Ratio
- 8.65
- EV to Sales
- 7.25
- EV Over EBITDA
- -9.26
- EV to Operating CashFlow
- -22.34
- EV to FreeCashFlow
- -22.25
- Earnings Yield
- -0.07
- FreeCashFlow Yield
- -0.04
- Market Cap
- 0,07 Bil.
- Enterprise Value
- 0,06 Bil.
- Graham Number
- 0.36
- Graham NetNet
- 0.06
Income Statement Metrics
- Net Income per Share
- -0.06
- Income Quality
- 0.59
- ROE
- -0.6
- Return On Assets
- -0.41
- Return On Capital Employed
- -0.9
- Net Income per EBT
- 1
- EBT Per Ebit
- 0.69
- Ebit per Revenue
- -0.75
- Effective Tax Rate
- 0
Margins
- Sales, General, & Administrative to Revenue
- 0.05
- Research & Developement to Revenue
- 0.09
- Stock Based Compensation to Revenue
- 0.19
- Gross Profit Margin
- 0.72
- Operating Profit Margin
- -0.75
- Pretax Profit Margin
- -0.52
- Net Profit Margin
- -0.52
Dividends
- Dividend Yield
- 0
- Dividend Yield %
- 0
- Payout Ratio
- 0
- Dividend Per Share
- 0
Operating Metrics
- Operating Cashflow per Share
- -0.03
- Free CashFlow per Share
- -0.03
- Capex to Operating CashFlow
- -0
- Capex to Revenue
- 0
- Capex to Depreciation
- 0.07
- Return on Invested Capital
- -0.81
- Return on Tangible Assets
- -0.39
- Days Sales Outstanding
- 70.98
- Days Payables Outstanding
- 343.98
- Days of Inventory on Hand
- 516.3
- Receivables Turnover
- 5.14
- Payables Turnover
- 1.06
- Inventory Turnover
- 0.71
- Capex per Share
- 0
Balance Sheet
- Cash per Share
- 0,07
- Book Value per Share
- 0,10
- Tangible Book Value per Share
- 0.1
- Shareholders Equity per Share
- 0.1
- Interest Debt per Share
- 0
- Debt to Equity
- 0.04
- Debt to Assets
- 0.03
- Net Debt to EBITDA
- 0.82
- Current Ratio
- 3
- Tangible Asset Value
- 0,01 Bil.
- Net Current Asset Value
- 0,01 Bil.
- Invested Capital
- 8154777
- Working Capital
- 0,01 Bil.
- Intangibles to Total Assets
- 0.01
- Average Receivables
- 0,00 Bil.
- Average Payables
- 0,00 Bil.
- Average Inventory
- 3094565
- Debt to Market Cap
- 0.01
Dividends
Dividends in stock investing are like rewards that companies give to their shareholders. They are a portion of the company's profits distributed to investors, typically in the form of cash payments, as a way for them to share in the company's success.
| Year | Dividends | Growth |
|---|
Milestone Scientific Inc. Profile
About Milestone Scientific Inc.
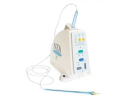
Milestone Scientific Inc. designs, develops, and commercializes diagnostic and therapeutic injection technologies, and devices for medical, dental, and cosmetic use in the United States, China, and internationally. The company operates in two segments, Dental and Medical. Its products include CompuDent and STA Single Tooth Anesthesia System that are used for all dental procedures that require local anesthetic. The company also offers CompuFlo, a computer-controlled drug delivery system for the painless delivery of drugs, anesthetics, and other medicaments, as well as for the aspiration of bodily fluids or previously injected substances; and disposable injection handpiece for the tactile control during the injection. In addition, it provides CompuFlo Epidural, a computer controlled anesthesia system for use in various medical applications. Further, the company offers CompuMed for use in various medical procedures performed in plastic, hair restoration, and colorectal surgery, as well as podiatry, dermatology, orthopedics, and various other disciplines. Milestone Scientific Inc. was incorporated in 1989 and is headquartered in Livingston, New Jersey.
- CEO
- Mr. Jan Adriaan Haverhals
- Employee
- 17
- Address
-
425 Eagle Rock Avenue
Roseland, 07068
Milestone Scientific Inc. Executives & BODs
| # | Name | Age |
|---|---|---|
| 1 |
Mr. Jan Adriaan Haverhals President, Chief Executive Officer & Director |
70 |
| 2 |
Mr. Leonard A. Osser Founder & Vice Chairman |
70 |
| 3 |
James Hippett J.D. Senior Vice President of Global Sales & Business Development |
70 |
| 4 |
Ms. Keisha Harcum Controller |
70 |
Milestone Scientific Inc. Competitors